
This week we’re going to talk about some bullpens because it’s that time of year. Over the next 3–4 weeks teams are going to figure out if they have a good bullpen for real, or if they’re going to have a bad bullpen forever. Here’s the state of the league, backed by the numbers.
The Tier List
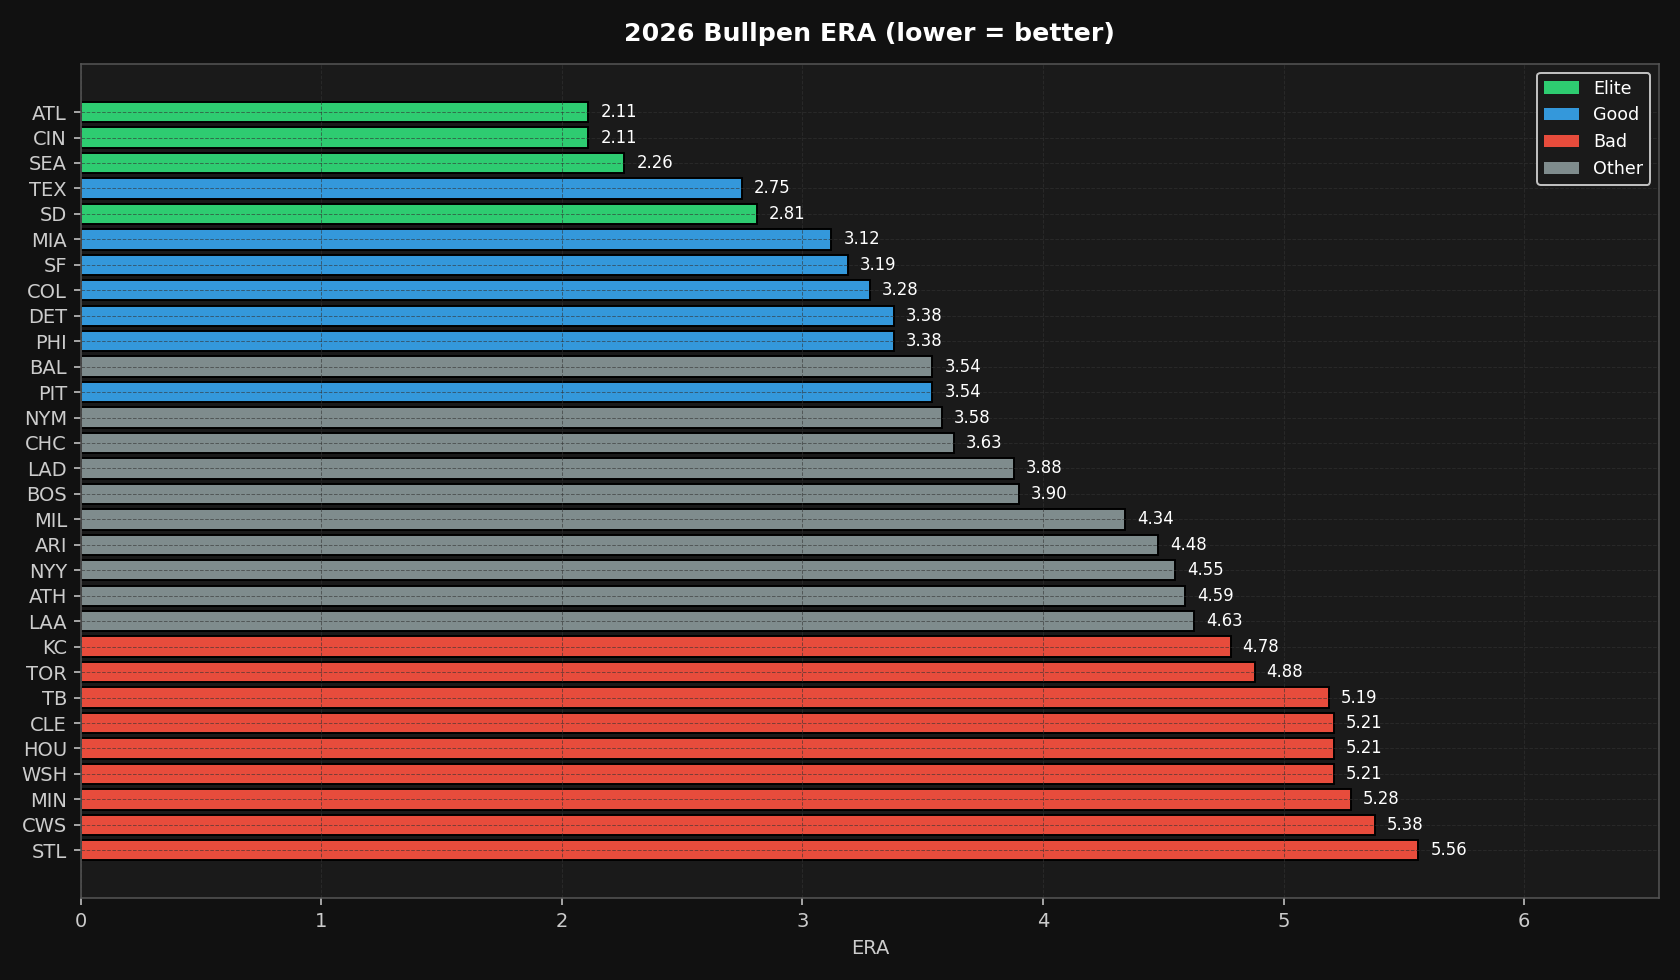
The Leaderboard
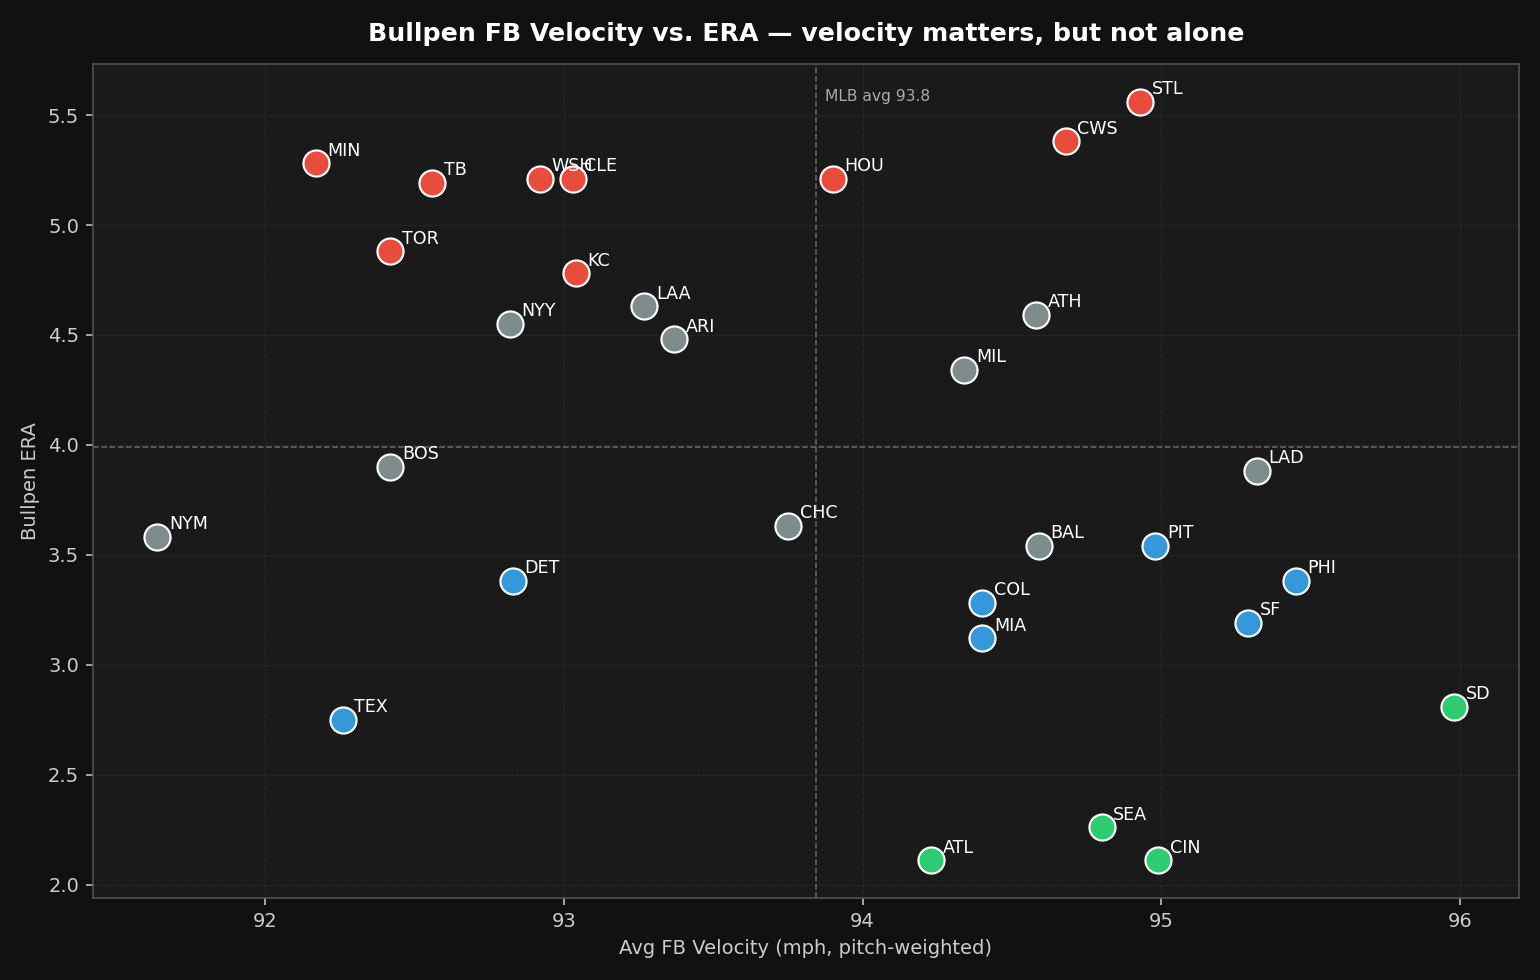
Velocity Matters (But It’s Not Everything)
One key indicator on bullpen quality is velocity. Most bullpen arms are two-pitch guys at most — their job is to come in and throw hard for 3–4 batters and keep the walks down. No team needs this more than Colorado, and it appears they’ve finally gotten the right pitching model to pitch in Coors. I don’t care if you give up homers, I care if you’re going to walk guys and give up contact. The Rockies rank #13 in MLB for bullpen FB velocity at 94.4 mph — well above league average. Bet you didn’t know that.
But velocity alone doesn’t save you — look at the Cardinals (#7 in velo, 94.9 mph) and White Sox (#9) sitting at the bottom of the ERA rankings. You need command behind the heat.
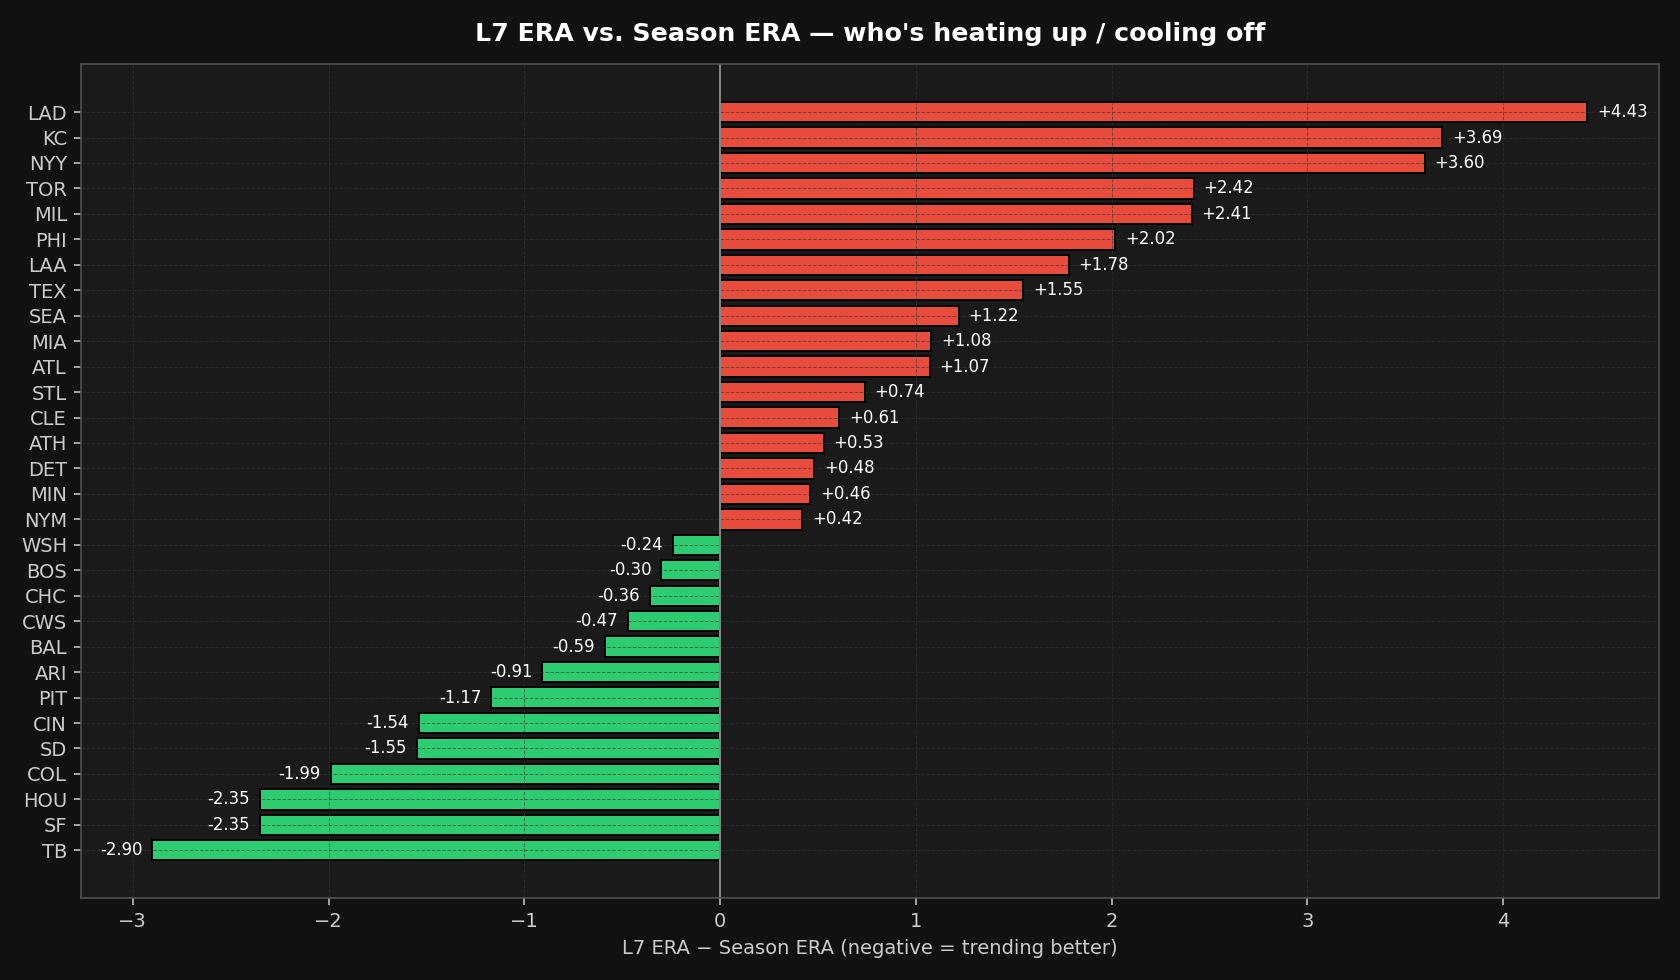
Who’s Trending (L7 vs Season)
Green bars = the last 7 days have been better than the season mark. This is where real bullpen tier changes start showing up.
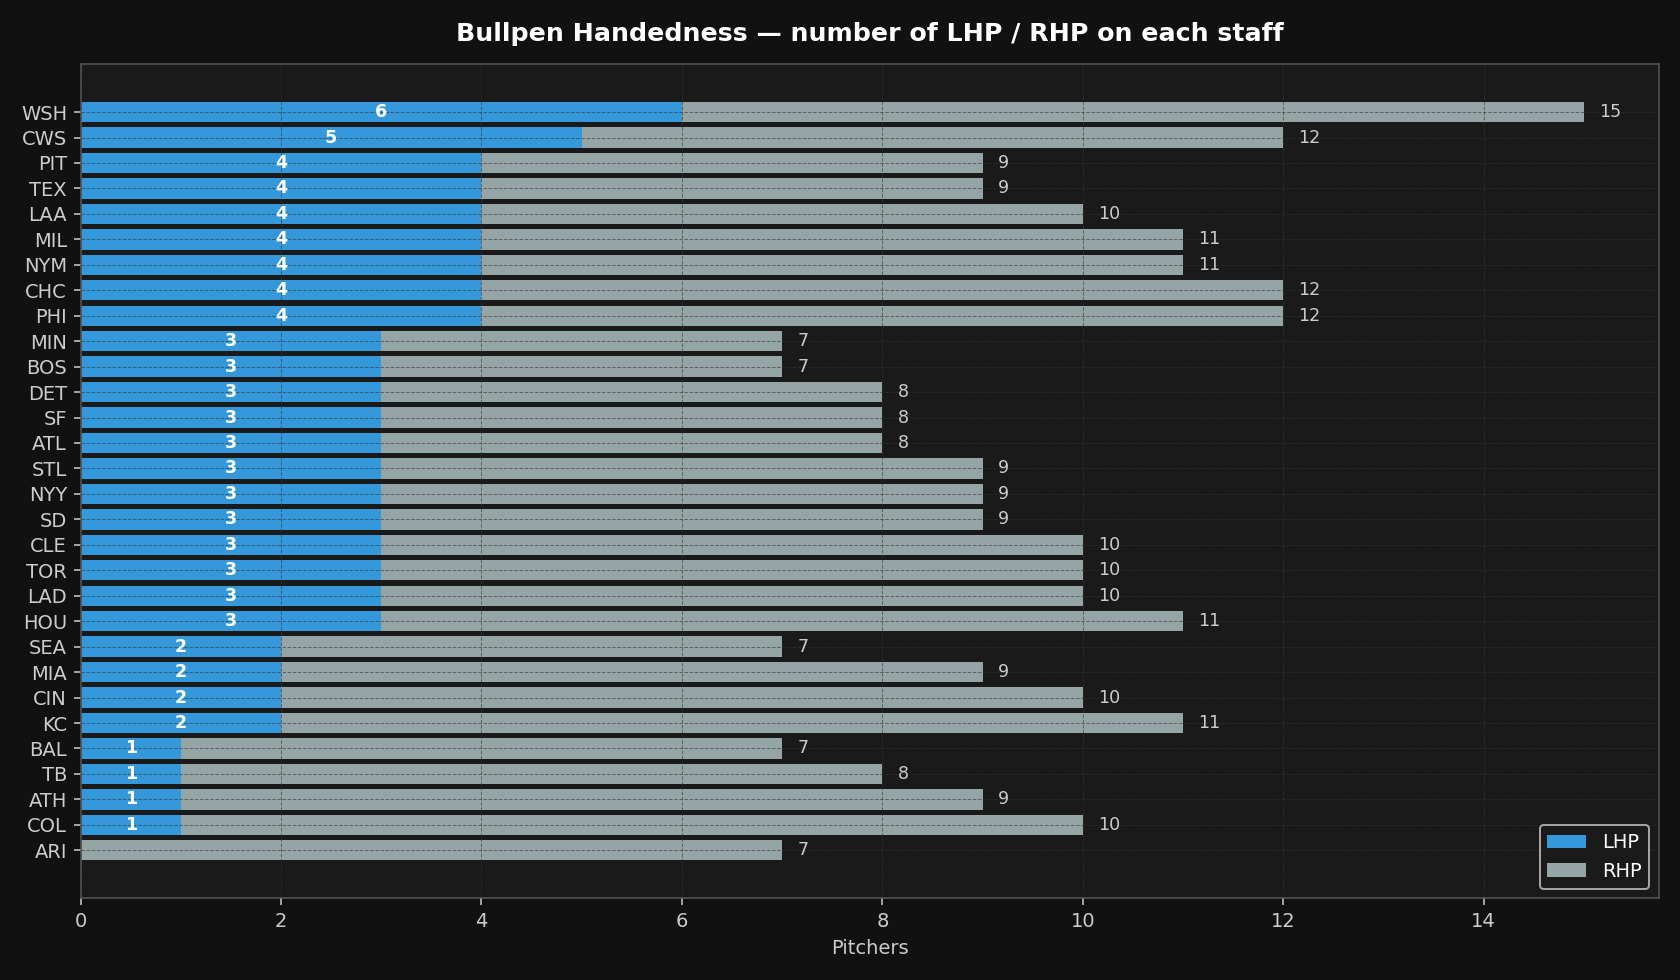
Handedness Check — The Arizona Problem
Diamondbacks still have zero LHP in their pen. This is a serious issue in games where the opponent has good LHH, is in Chase Field, and can hit their starter early. We should keep this in mind big time for stacks. They’re the only team in MLB with no lefty option.
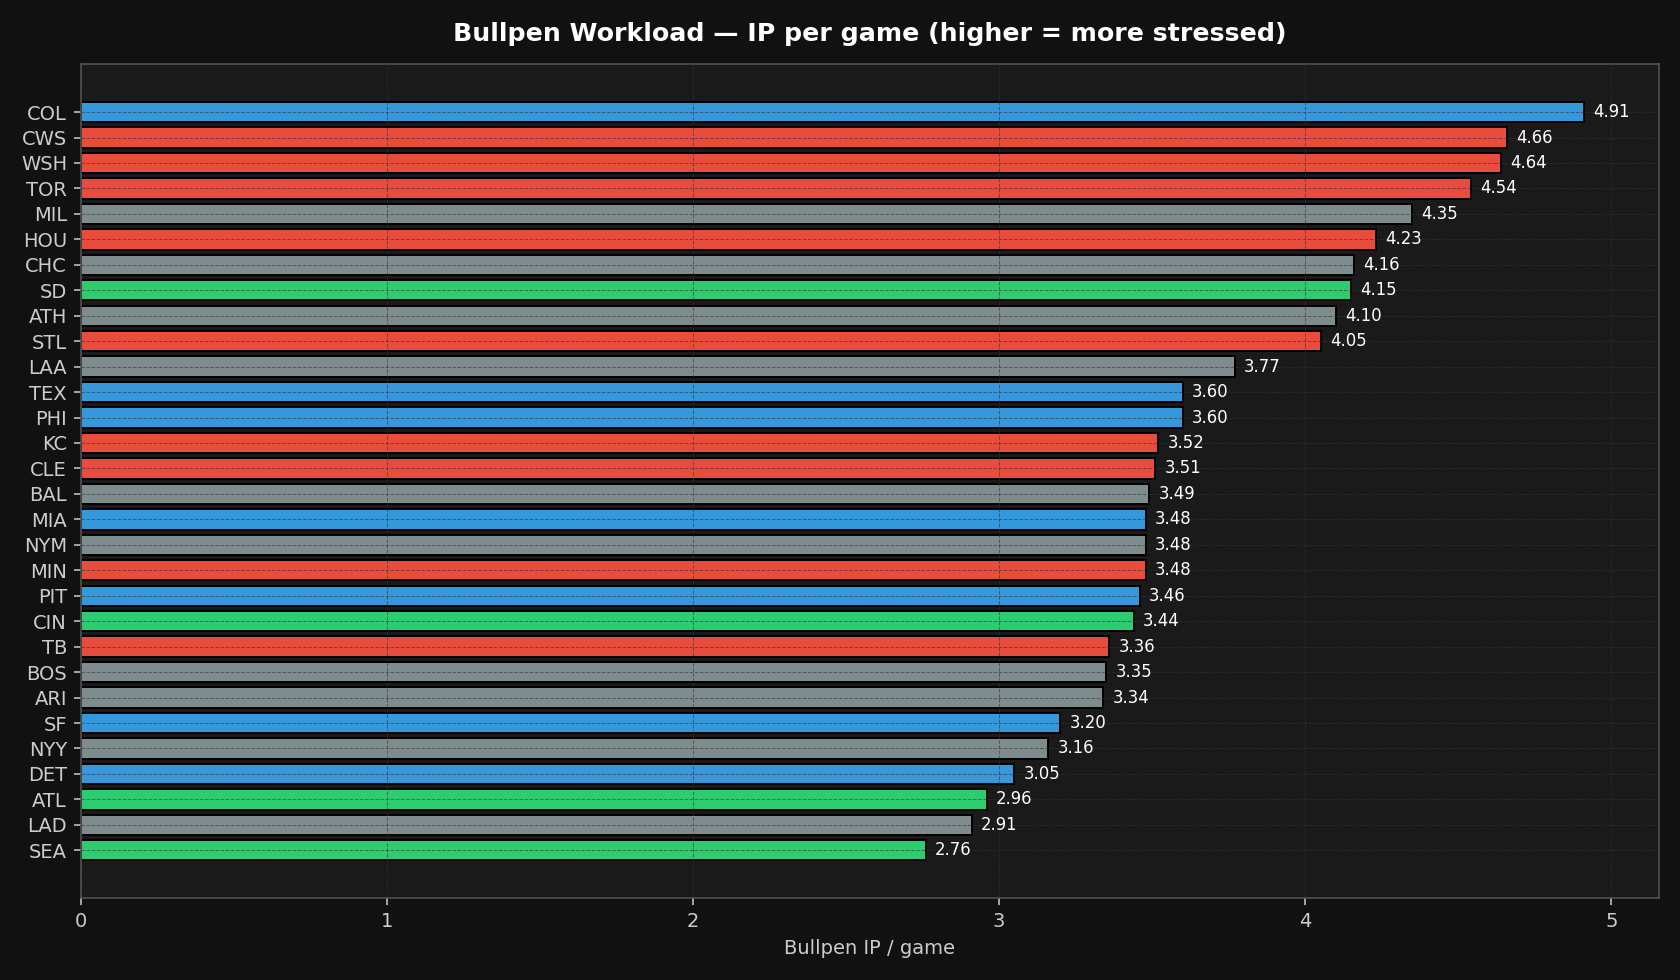
Workload — Who’s Getting Burned Out?
The Nationals are using their bullpen a ton — 3rd-most bullpen IP/game in MLB (4.64) — and it’s not great. They can’t strike guys out (17.7% K, worst in MLB) but they do mostly give up ground balls, so they’ve got that going for them, I guess. Colorado and White Sox also at risk of late-season collapse from pure workload.
Team-by-Team
Reds (Elite)
League’s best bullpen ERA at 2.11 — but the walk rate is a red flag. Cincy bullpens are walking batters at a 14.7% clip (only MIA is worse). They’re papering over it with strikeouts (25.7% K) and 94.99 mph fastballs (#5 in MLB). Regression coming if walks don’t tighten, but right now it’s working.
Braves (Elite)
The quiet #1. Matching Cincy’s 2.11 ERA but doing it the right way — 6.5% walk rate (2nd-best in MLB), 0.89 WHIP, and only 0.30 HR/9 (best in baseball). Fastball velo is only 94.2 mph (mid-pack), so this is skill and deception over raw stuff. Real deal.
Mariners (Elite)
2.26 ERA, 3.10 FIP, and the T-Mobile effect is real. They’re also getting the most rest in baseball — only 2.76 bullpen IP/game, lowest in MLB. Fresh arms, strike throwers (7.9% BB). Formula working.
Padres (Elite)
2.81 ERA and the #1 bullpen FB velocity in baseball at 96.0 mph. Ridiculous 58.9% ground ball rate (also MLB-best), only 0.22 HR/9. They miss bats (26.3% K), they don’t walk guys (8.8% BB), and they keep the ball on the ground. Textbook elite bullpen.
Rockies (Good)
The under-the-radar callout. Colorado’s bullpen sits at 94.4 mph — #13 in MLB and well above the 93.7 league average. Exactly the profile you want in Coors: short outings, hard throwers, limit the walks (9.1%). They’re also being asked to eat the most innings in baseball (4.91 IP/g) and have been ELITE in the last 7 days (1.29 ERA). Watch for cracks from usage, but right now the model works.
Rangers (Good)
2.75 ERA is actually elite-tier. The catch: 10.3% walk rate and a mid-90s velocity floor (92.3 mph, below league avg) suggests regression. FIP of 3.78 is the tell — they’ve been lucky.
Marlins (Good)
Best K rate in baseball at 28.0%, only 0.14 HR/9. But a 15.0% walk rate — MLB-worst — keeps them out of the elite tier. When they throw strikes, nobody hits them. Problem is, they don’t throw strikes.
Giants (Good)
3.19 ERA, 95.3 mph FB velo (#4). And they’ve been the 2nd-best bullpen in baseball the last 7 days (0.84 L7 ERA). Trending elite.
Phillies, Tigers, Pirates (Good)
PHI: 3.38 ERA, 95.5 mph (#2). Phillies bring heat. DET: 3.38 ERA despite only 92.8 mph — crafty. PIT: Top-tier velocity (95.0 mph, #6) with some homer issues (1.18 HR/9).
Diamondbacks (No-LHP Exploit)
Zero LHP in the bullpen. Zero. Every other MLB team has at least one. In a game with LHH stacks and an early-knocked starter at Chase, Arizona has to go RHP-on-LHH in high-leverage — prime stacking territory. Their overall 4.48 ERA masks this matchup exploit.
Nationals (Bad)
5.21 ERA and the 3rd-most bullpen IP in MLB (4.64 per game). 17.7% K rate is the worst in baseball — they can’t miss a bat. Only positive: 50.5% GB rate limits the damage. They’re using a 16-arm bullpen pool trying to survive.
Cardinals (Worst)
5.56 ERA is bottom-of-the-league, but the weird thing is the velocity — 94.9 mph, #7 in MLB. The stuff is there; the results aren’t. 17.7% K rate is next-to-last. Something’s not translating.
White Sox (Bad)
5.38 ERA, but again — 94.7 mph FB velo (#9). Velocity without command: 12.8% BB rate. They also lead MLB in total bullpen IP (93.2) from a staff with the most arms (14). Garbage-time innings, basically.
Twins, Astros, Guardians, Rays, Jays, Royals (Bad)
MIN: 5.28 ERA, 92.2 mph (below avg). HOU: 5.21 ERA, 1.64 HR/9 — getting taken deep. CLE: 5.21 ERA despite a 27% K rate; their 35.9% GB rate is MLB-worst. Every mistake leaves the yard. TB: 5.19 ERA. The Rays Magic has expired. TOR: 4.88 ERA and 7.30 in L7 — cratering. KC: 8.47 L7 ERA. In freefall.
Full Leaderboard
| Team | Tier | ERA | FIP | WHIP | K% | BB% | GB% | FB Velo | Velo Rk | L7 ERA | LHP |
|---|---|---|---|---|---|---|---|---|---|---|---|
| ATL | ELITE | 2.11 | 2.65 | 0.89 | 23.8 | 6.5 | 43.7 | 94.2 | #15 | 3.18 | 3 |
| CIN | ELITE | 2.11 | 3.49 | 1.29 | 25.7 | 14.7 | 41.9 | 95.0 | #5 | 0.57 | 2 |
| SEA | ELITE | 2.26 | 3.10 | 1.19 | 23.6 | 7.9 | 42.3 | 94.8 | #8 | 3.48 | 2 |
| TEX | GOOD | 2.75 | 3.78 | 1.28 | 20.5 | 10.3 | 38.5 | 92.3 | #28 | 4.30 | 4 |
| SD | ELITE | 2.81 | 2.50 | 1.14 | 26.3 | 8.8 | 58.9 | 96.0 | #1 | 1.26 | 3 |
| MIA | GOOD | 3.12 | 3.05 | 1.22 | 28.0 | 15.0 | 42.9 | 94.4 | #12 | 4.20 | 2 |
| SF | GOOD | 3.19 | 3.77 | 1.18 | 25.9 | 10.9 | 47.9 | 95.3 | #4 | 0.84 | 3 |
| COL | GOOD | 3.28 | 3.91 | 1.27 | 21.8 | 9.1 | 47.4 | 94.4 | #13 | 1.29 | 1 |
| DET | GOOD | 3.38 | 4.22 | 1.33 | 21.6 | 12.1 | 51.5 | 92.8 | #23 | 3.86 | 3 |
| PHI | GOOD | 3.38 | 3.00 | 1.17 | 25.0 | 7.7 | 49.3 | 95.5 | #2 | 5.40 | 4 |
| BAL | — | 3.54 | 3.64 | 1.17 | 29.4 | 10.0 | 52.7 | 94.6 | #10 | 2.95 | 1 |
| PIT | GOOD | 3.54 | 4.45 | 1.36 | 25.1 | 12.0 | 46.0 | 95.0 | #6 | 2.37 | 4 |
| NYM | — | 3.58 | 3.58 | 1.27 | 20.3 | 8.5 | 46.3 | 91.6 | #30 | 4.00 | 4 |
| CHC | — | 3.63 | 4.12 | 1.27 | 22.2 | 7.8 | 47.4 | 93.8 | #17 | 3.27 | 4 |
| LAD | — | 3.88 | 3.15 | 1.22 | 23.6 | 9.6 | 42.9 | 95.3 | #3 | 8.31 | 3 |
| BOS | — | 3.90 | 5.31 | 1.22 | 21.4 | 10.7 | 50.4 | 92.4 | #26 | 3.60 | 3 |
| MIL | — | 4.34 | 3.61 | 1.57 | 21.9 | 12.2 | 59.3 | 94.3 | #14 | 6.75 | 4 |
| ARI | — | 4.48 | 4.04 | 1.15 | 21.8 | 8.0 | 49.7 | 93.4 | #18 | 3.57 | 0 |
| NYY | — | 4.55 | 3.61 | 1.50 | 22.0 | 9.4 | 49.6 | 92.8 | #24 | 8.15 | 3 |
| ATH | — | 4.59 | 4.69 | 1.61 | 19.4 | 13.4 | 50.8 | 94.6 | #11 | 5.12 | 1 |
| LAA | — | 4.63 | 4.79 | 1.52 | 22.5 | 14.0 | 45.3 | 93.3 | #19 | 6.41 | 4 |
| KC | BAD | 4.78 | 4.68 | 1.48 | 23.2 | 13.0 | 48.4 | 93.0 | #20 | 8.47 | 2 |
| TOR | BAD | 4.88 | 4.00 | 1.41 | 26.9 | 9.1 | 56.4 | 92.4 | #27 | 7.30 | 3 |
| TB | BAD | 5.19 | 4.93 | 1.46 | 20.7 | 11.0 | 44.5 | 92.6 | #25 | 2.29 | 1 |
| CLE | BAD | 5.21 | 4.23 | 1.35 | 27.0 | 8.7 | 35.9 | 93.0 | #21 | 5.82 | 3 |
| HOU | BAD | 5.21 | 5.24 | 1.54 | 24.1 | 12.8 | 39.0 | 93.9 | #16 | 2.86 | 3 |
| WSH | BAD | 5.21 | 5.71 | 1.46 | 17.7 | 10.7 | 50.5 | 92.9 | #22 | 4.97 | 6 |
| MIN | BAD | 5.28 | 4.35 | 1.66 | 19.0 | 11.4 | 43.8 | 92.2 | #29 | 5.74 | 3 |
| CWS | BAD | 5.38 | 4.53 | 1.64 | 18.6 | 12.8 | 46.6 | 94.7 | #9 | 4.91 | 5 |
| STL | BAD | 5.56 | 4.69 | 1.49 | 17.7 | 12.7 | 50.0 | 94.9 | #7 | 6.30 | 3 |
Data: FanGraphs bullpen splits + Baseball Savant pitch-level data. Fastballs = FF+SI+FC, pitch-weighted. Season velo includes only relievers with an appearance in the last 10 days. Generated 2026-04-20.