
Washington’s defense has one glaring weakness, and Indianapolis just put the player who would exploit it on injured reserve. Through three games the Commanders have been very good against the run (opponents lose 0.137 EPA per carry) and terrible against the deep ball: 1.792 EPA per pass on 12 throws deep to the right. Alec Pierce averaged a 19.3-yard depth of target in Daniel Jones’ starts and is now on IR with a heel injury. The receiver who replaced him last week drew one target on 31 routes. So at 9:30 on a Sunday morning in London, the softest part of this defense will probably go untested, and the Colts will do what they were going to do anyway, which is hand the ball to Jonathan Taylor. It’s breakfast football, and Indianapolis has no plans to take the menu deep.
Stephen’s take on this game is simple: Taylor runs buckwild on Washington. Our numbers agree on the volume. They disagree on the touchdown price, and they think the market has overreacted on the rest of the Colts offense:
- Taylor’s volume: our simulation gives him 23.2 carries for 103 yards, against a rushing line of 90.5. That part of Stephen’s take holds up.
- Taylor’s efficiency: he faces the better of the two run defenses. Washington’s soft spot is its pass defense, and the weaker run defense in this game is Indianapolis’s, which faces Jacory Croskey-Merritt at 6.8% ownership.
- Indy’s pass catchers: this week the books have cut Jones’ passing yards from 228.5 to 219.5 while raising Josh Downs from 64.5 to 71.5 and Tyler Warren from 47.5 to 54.5. Those lines can’t all be right. If Taylor gets 23 carries, the receiving lines are the ones that are wrong.
Model vs. market: anytime touchdowns
We converted projected rushing and receiving touchdowns into a probability of scoring at least once, then compared it with the best price at the six major US books. Nobody on this board is fairly priced. Our ratios range from 0.56 to 0.79, so the market is pricing more scoring than we are on every player.
| Player | Best price | Market | Model | Ratio |
|---|---|---|---|---|
| Jonathan TaylorIND · RB | -285 | 74.0% | 53.4% | 0.72 |
| Jacory Croskey-MerrittWSH · RB | +110 | 47.6% | 34.9% | 0.73 |
| Tyler WarrenIND · TE | +170 | 37.0% | 27.2% | 0.74 |
| Chig OkonkwoWSH · TE | +390 | 20.4% | 16.1% | 0.79 |
| Stefon DiggsWSH · WR | +220 | 31.2% | 18.5% | 0.59 |
| Josh DownsIND · WR | +160 | 38.5% | 21.7% | 0.56 |
Taylor at -285 asks you to believe he scores 74% of the time. Our projection says 53%, and even our simulation, which is the more generous of our two models on Taylor, only reaches 66%. Washington has held the top backs from its first three opponents to 4.0 yards per carry, so the yards come from volume and goal-line chances are scarcer than the price assumes. That’s the one place we disagree with Stephen. Taylor can run buckwild between the 20s and still finish with no touchdown. Downs at 0.56 is the steepest price on the board: the market is paying for touchdowns from Indy’s passing game in a game script that keeps the ball on the ground.
Model vs. market: ownership
Taylor is projected at 41.4% ownership, and for once the chalk is correct. His ceiling-weighted score (0.65 × ceiling + 0.35 × projection) is 29.2, five points clear of anyone else in the pool. The edges are further down the board.
Croskey-Merritt is the biggest gap. With Rachaad White out, he’s Washington’s lead back, with a 20.7-point ceiling at 6.8% ownership. Indianapolis allows 0.147 EPA per carry, the worse of the two run defenses in this game, and it gave up 163 and 178 rushing yards to the first two lead backs it faced this season. Stephen’s game script works for both teams’ running backs, and the field is only playing Indy’s.
On the Washington passing side, the field is on the quarterback rather than his receiver. Marcus Mariota is projected at 21.4% ownership, while Stefon Diggs, with a 21.3-point ceiling, is at 6.8%. If Washington trails, as the 4.5-point spread suggests, Diggs gets the catch-up volume. Mariota’s ceiling also depends on his legs, and Indy’s pass rush has 7 sacks in three games.
The two defenses are close in ownership (10.4% and 11.0%) and neither is a captain. Treat them as salary decisions.
Team context worth carrying
- Washington: last week’s 33 points against Seattle overstate this offense. Washington averaged 4.0 yards per play, was outgained by nearly 180 yards and needed three takeaways, one returned for a touchdown. Jayden Daniels (dislocated elbow) is out again, so Mariota makes his second straight start.
- Indianapolis: the Colts’ defense allows 0.388 EPA per pass play, the worst unit on the field. It’s why a 4.5-point favorite carries only a 25.5-point team total, why our simulation still has Washington scoring 21.2, and why Washington’s late volume is worth rostering.
See the full showdown analysis. Captain board, every prop against our projection, the optimizer and exposure.
Captain and build
Taylor is the captain. Being 41% owned doesn’t change the fact that he has the best ceiling in the pool, and the play-by-play has him getting the carries. Fading him to be different means betting against the one outcome the market and our models agree on. Instead, we get leverage in the flex: Jones at quarterback, then Diggs and Croskey-Merritt, two Washington players at 6.8% each whose points come from the same script that gives Taylor his carries.
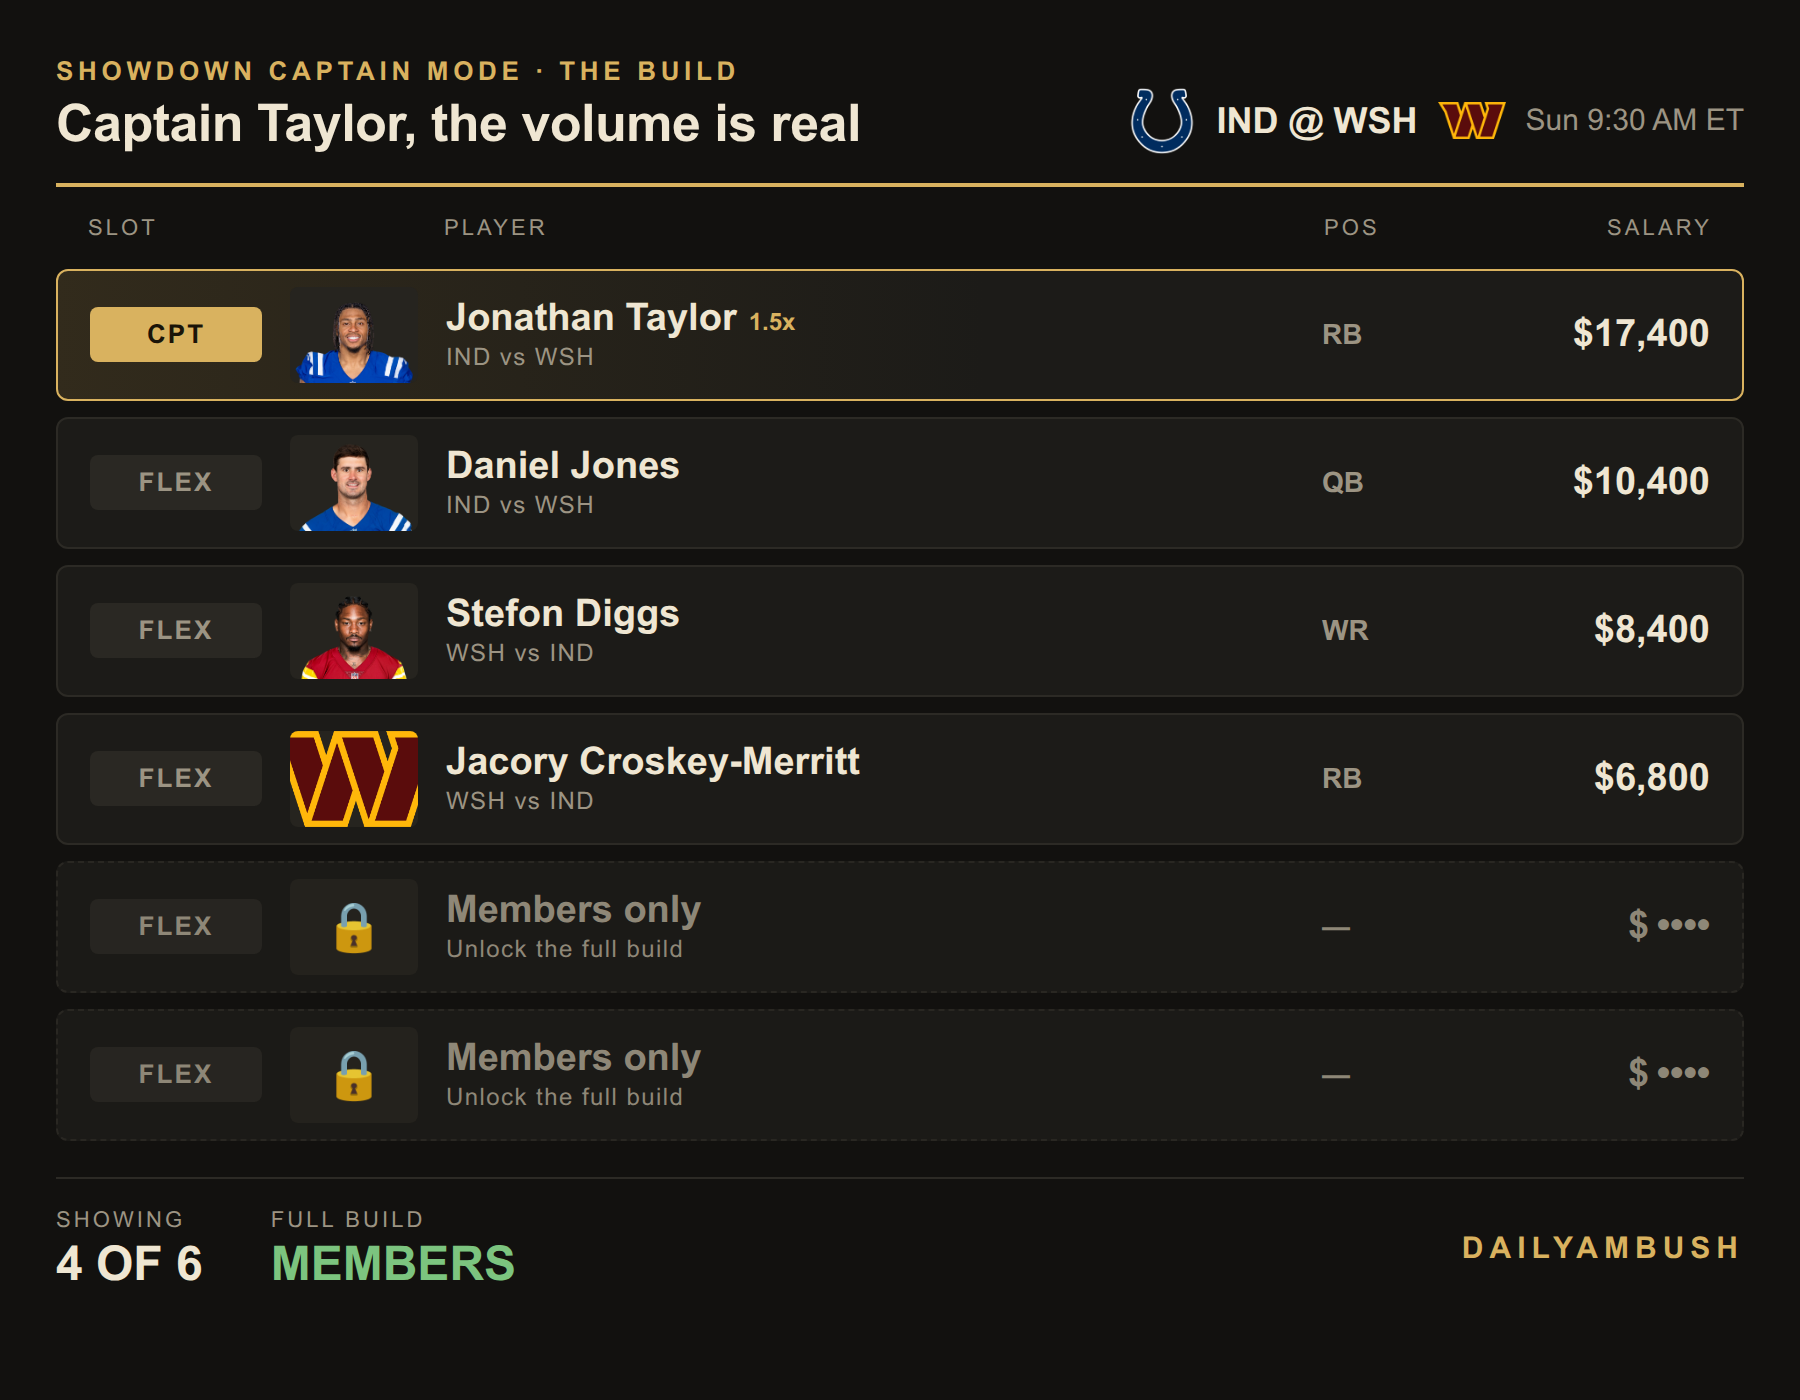
The last two spots are members-only. Get the full build, plus the Showdown Lab optimizer for your own.
The bets
- Jonathan Taylor Over 90.5 rushing yards, -113 (FanDuel; 91.5 at DraftKings and BetMGM). This is Stephen’s take as a bet. Our simulation has him at 23.2 carries and 103 yards. Our weekly projection is lower (16 carries, 84 yards), but that carry count is well short of the roughly 22 per game he’s averaged this season. With Washington on its backup quarterback, we trust the simulation.
- Josh Downs Under 6.5 receptions, +111 (DraftKings; +106 FanDuel). Our projection has him at 4.1 catches on 6.4 targets, and the simulation has 4.6 on 7.4. The Bureau flagged the Under at 5.5 earlier this week. The books have since moved the line up a full catch and made the Under plus money. That’s the same overreaction as point 3 above, and this is the cleanest way to bet it.
No captain touchdown this week. Taylor’s -285 needs 74% and we have him at 53%, and nobody else on the board reaches 0.8. No total or spread either. The Over is 46.5 at -110 at FanDuel, and our simulation has the Over at 53.7%, which is barely better than breakeven.
Method: model touchdown probability = 1 − e−λ, where λ is projected rushing plus receiving touchdowns. The simulation is 20,000 runs drawn around the Vegas team totals, with pace, carry shares and target shares from our play-by-play. All numbers are from the DailyAmbush showdown ratings, projections, simulation and Bureau board as of Saturday evening. Lines move, so check your book before the 9:30 a.m. ET kickoff.