
Sean Payton took the play sheet back last week, handed J.K. Dobbins 18 carries and a season-high 52% of the snaps, and beat the Chargers 23-17. When he looked up, Bo Nix was still his quarterback. Nix is at 5.8 yards per attempt through five games, and Denver scores 18.5 points a game. Now Payton’s new run-first plan meets the best run defense on the field: Seattle allows −0.155 EPA per rush, while Denver allows +0.049. Seattle has the opposite problem. It has scored 29 or more in four straight games and still lost two of them, by a combined five points. It has also lost its top two running backs.
The total has dropped from 43.5 to 40.5, and our 20,000 simulations land right on it (Over 49.5%). Where we part ways with the crowd is how the points get scored. Seattle runs 28.6 times per simulated game and passes only 24.5. Most of the running-back work goes to Emanuel Wilson (15.2 carries to George Holani’s 5.4), who is projected for 6.4% ownership, while Nix sits on 52.1% of rosters. Three things follow from that:
- Seattle’s backfield: Wilson’s sim mean of 12.1 is the highest of any non-quarterback in the game except Jaxon Smith-Njigba, and the field has him at 6.4%.
- Sam Darnold’s yardage: we have him at 177 to 190 passing yards against a 222.5 line.
- Denver’s receivers: the low ownership on Jaylen Waddle and Courtland Sutton is earned, and the receptions market hasn’t fully caught up.
Model vs. market: anytime touchdowns
We turned projected rushing and receiving touchdowns into the chance of scoring at least once, then compared that with the best price at the six books. The ratio is the number to watch: it shows how much of the market’s price our model supports.
| Player | Best price | Market | Model | Ratio |
|---|---|---|---|---|
| Jaxon Smith-NjigbaSEA · WR | +110 | 47.6% | 24.3% | 0.51 |
| Emanuel WilsonSEA · RB | +120 | 45.5% | 38.2% | 0.84 |
| J.K. DobbinsDEN · RB | +190 | 34.5% | 35.2% | 1.02 |
| Jaylen WaddleDEN · WR | +270 | 27.0% | 15.4% | 0.57 |
| RJ HarveyDEN · RB | +300 | 25.0% | 24.1% | 0.96 |
| George HolaniSEA · RB | +500 | 16.7% | 27.0% | 1.62 |
Smith-Njigba at +110 is the most expensive touchdown on the board, and our number is half of it. That isn’t a knock on the player. Darnold has thrown him 129 targets in 16 starts at 0.441 EPA per target, and Denver’s pass defense is weakest over the short middle (0.262 EPA allowed) and to the short left (0.214), two areas Seattle throws to often. His case is catches and yards. The touchdown price already assumes the best of it.
Dobbins is the one starter the model fully backs, and he gets there on volume (12 projected carries to Harvey’s 7). Holani’s 1.62 looks like the best number on the board, but it’s a backup’s number. Wilson has had all six of Seattle’s red-zone opportunities over the past two weeks, so we don’t trust the model’s share for Holani and we aren’t betting it.
Model vs. market: ownership
The field is building around Nix (52.1%), then Darnold (27.2%) and Smith-Njigba (20.8%). We don’t fight the Nix chalk: his 14.9-point sim mean is the best of either quarterback, and in a 40.5 total a quarterback is the floor. The leverage is in Seattle’s backfield. With the top two backs out (Zach Charbonnet on PUP, Jadarian Price on IR), Wilson is the lone lead runner. He averages 15.2 carries per simulated game against a defense that gives up +0.049 EPA per rush. That’s a 90th percentile of 19.7 and a ceiling of 40.3, at 6.4% owned. Dobbins, at 8.7%, has the opposite setup: the same kind of role, but against a run defense allowing −0.155.
Waddle (5.2%) and Sutton (5.4%) both have tails worth noting, with sim ceilings of 41.2 and 38.5, but the low ownership isn’t a mistake. Seattle allows a league-low 150.8 passing yards a game and plays a man-heavy press scheme. Devon Witherspoon shadows the opponent’s top receiver. Nix has to get the ball out against that look on a short week.
The DST prices barely differ. Seattle’s projects 6.85 and Denver’s 6.45, with ceilings within a point of each other, yet Seattle’s is owned at 16.4% and Denver’s at 6.8%. Darnold was sacked five times by San Francisco last week, and Denver’s front has 13 sacks this year.
Team context worth carrying
- Seattle: Smith-Njigba had his ankle taped during the San Francisco game and still practiced in full Wednesday with no designation. Through 16 starts, Darnold has thrown to him nearly twice as often as to anyone else (129 targets to AJ Barner’s 66).
- Denver: Pat Surtain II and Talanoa Hufanga are both out, so the secondary covering Smith-Njigba is a backup corner group. That’s why Darnold’s yardage line sits at 222.5 even though Seattle runs more than it throws.
See the full showdown analysis. Captain board, every prop against our projection, the optimizer and exposure.
Captain and build
Wilson is the captain. Smith-Njigba has the highest ceiling in the game, but at captain he costs $17,400 and a fifth of the field is already on him. Wilson’s role is just as certain, his matchup is the softest on the field, and the projected 6.4% ownership will be lower still at CPT. Smith-Njigba goes in the flex. Nix stays as the quarterback because he’s the best quarterback here, crowd or no crowd. Rashid Shaheed rounds out the visible spots: his snaps dipped to 46%, but his 33.9 sim ceiling is still the best of Seattle’s secondary receivers.
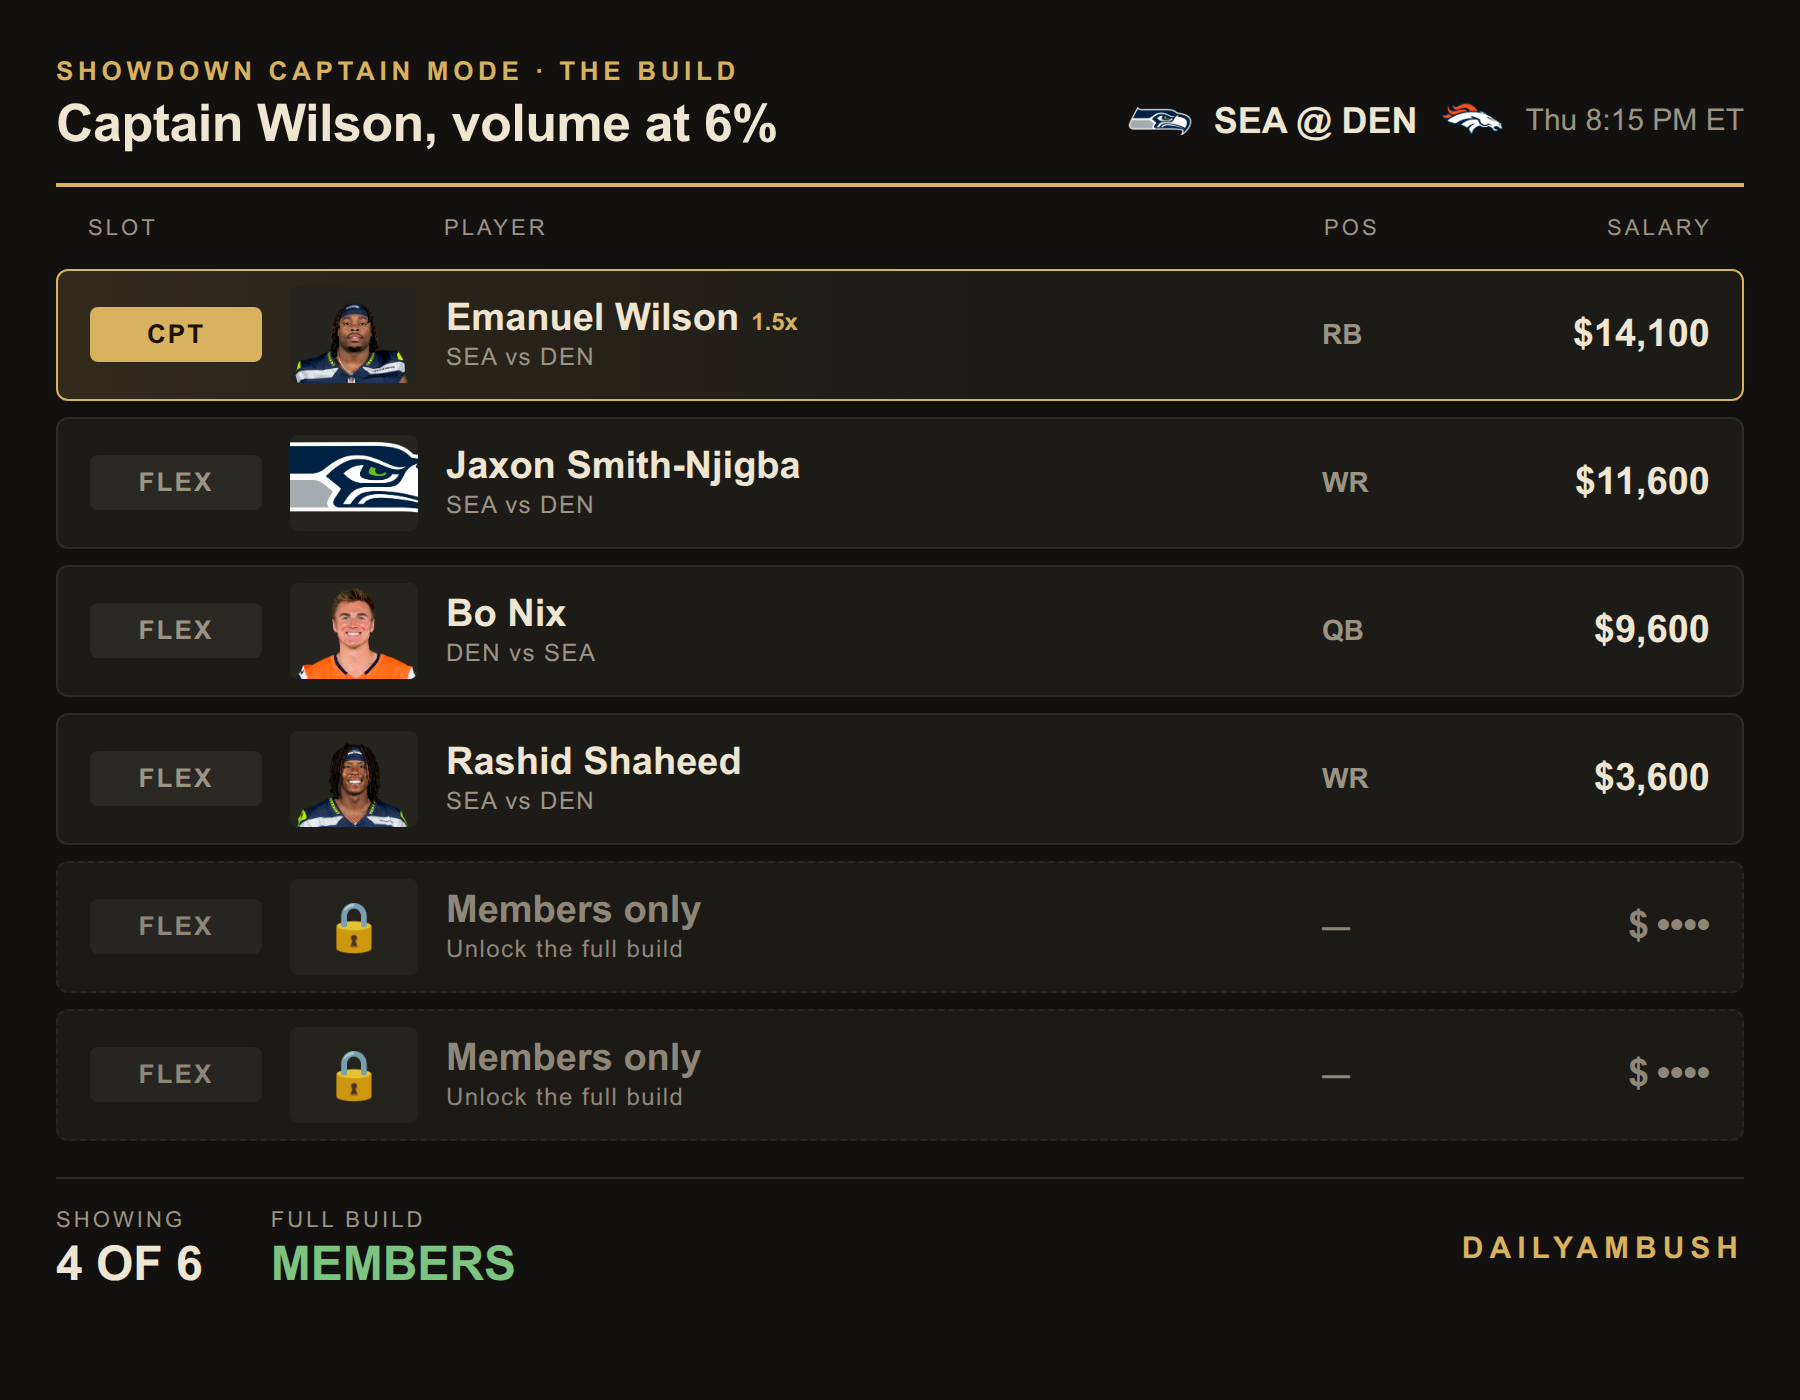
The last two spots are members-only. Get the full build, plus the Showdown Lab optimizer for your own.
The bets
- Sam Darnold Under 222.5 passing yards, −115 (BetMGM; 220.5 at −113 at DraftKings and FanDuel). Our projection is 177 and the sim mean is 190, both on about 25 attempts. The line is pricing in Denver’s missing corners. We’re pricing in a Seattle offense that runs 28 times and gets its points from the backfield.
- Jaylen Waddle Under 4.5 receptions, −140 (BetMGM; −148 FanDuel, −152 DraftKings). We project 3.7 catches and the sim says 3.6, on about six targets into a shadow corner. Our board has the Under at 65%. Even at −140 (58.3% implied) it clears.
- J.K. Dobbins anytime TD, +190 (DraftKings; +185 FanDuel). The only touchdown price our model fully supports. He’s the Denver starter with the goal-line role, and the price is fair rather than generous, so keep the stake small.
No captain touchdown bet. Wilson at +120 implies 45.5% and we have him at 38.2%. Every point of his DFS value comes from volume, and the touchdown price already charges you for it. No side and no total either: our simulation anchors team totals to the market by design, so the 54.5% cover rate on Seattle −2.5 and the 49.5% Over aren’t edges.
Method: model touchdown probability = 1 − e−λ, where λ is projected rushing plus receiving touchdowns. All numbers come from the DailyAmbush showdown ratings, projections, 20,000-run game simulation and Bureau board as of Thursday morning. Lines move, so check your book before the 8:15 ET kickoff.