
The last time Washington and New York met, in Week 5, it finished 27-27, so each team’s record now carries the same tie. The Giants are 5-2-1 and the Commanders 2-5-1, and the rematch total opened at 46.5. It is now 41, a 5.5-point drop, with drizzle and a 12 mph wind in the forecast. The market has priced out the shootout. Our 20,000 simulations land in the same place: the over at 49.7%, Giants by about two, and New York covering 2.5 in 50.8% of runs. The total is fairly priced. The mistakes are in how the field has divided the points between the players:
- The Giants’ passing game: the field is on the quarterback and the No. 2 receiver while the player with the ceiling sits at 17% ownership.
- The middle of the field: it is where Washington’s defense leaks and where New York throws best, and the tight end there is owned by 5% of lineups.
- The Giants’ backfield: Devin Singletary is priced off a 93% snap week that the simulation does not expect him to repeat.
- Washington’s receivers: one week after the depth chart turned over, the reception lines still assume volume the sim doesn’t see.
Model vs. market: anytime touchdowns
We turned projected rushing and receiving touchdowns into the probability of at least one score and compared it with the best price at the six books. In a game with a 41 total and rain in the forecast, our projections are short of the books on nearly every pass-catcher.
| Player | Best price | Market | Model | Ratio |
|---|---|---|---|---|
| Rachaad WhiteWSH · RB | +175 | 36.4% | 30.3% | 0.83 |
| Malik NabersNYG · WR | +175 | 36.4% | 18.9% | 0.52 |
| Isaiah LikelyNYG · TE | +210 | 32.3% | 12.5% | 0.39 |
| Stefon DiggsWSH · WR | +255 | 28.2% | 16.8% | 0.60 |
| Austin EkelerWSH · RB | +330 | 23.3% | 23.0% | 0.99 |
| Malachi FieldsNYG · WR | +450 | 18.2% | 16.0% | 0.88 |
Nabers and Likely are the two shortest touchdown prices on New York’s side, and our projection supports about half of the first and well under half of the second. Ekeler is the only price the model fully backs, but our two models disagree on him. The projection gives him seven carries. The simulation, built from his snaps, gives him 2.5 and puts his touchdown chance near 13%. When our own models split that widely, we don’t bet it. The table has no pick this week. That is the honest answer for a game where a 41 total has to cover two teams’ touchdowns.
Model vs. market: ownership
Projected ownership is highest on J.J. McCarthy and Malachi Fields, both at 62%, and next on Jayden Daniels at 52.8%. Malik Nabers costs $11,000 and is at 17.3%. Nabers has the best simulated distribution in the game: a 14.9 mean, 25.8 at the 90th percentile and a 51.5 ceiling. Fields simulates to a 5.8 mean and a 33.2 ceiling, on 3.1 targets. So the field has a receiver at nearly four times the ownership of the one who drives New York’s passing game, and the gap holds no matter how the game script goes.
Isaiah Likely is the other gap. He is at 5.0% ownership, with a 9.4 simulated mean and a 39.0 ceiling, almost level with Diggs (9.6 and 39.5), who costs $1,000 more. Singletary is the gap in the other direction, at 40.1% ownership for $8,000. His 93% snap share last week came with the lead back out of the lineup. With that back expected to return, the sim gives Singletary 4.5 carries and a 4.8 mean.
On defenses, the Giants DST is at 20.4% ownership and Washington’s at 9.8%, about a point apart in projection (7.04 vs. 6.64). Neither is a captain. New York’s defense allows 0.061 EPA per dropback, which is the better unit on paper. Washington’s has 46 QB hits, which is the better chance at a turnover.
Team context worth carrying
- Washington’s defense stops the run and gets thrown on. It allows 0.033 EPA per rush and 0.173 per dropback, and in the short middle it gives up 0.483 per throw on 53 attempts. That is also where New York’s offense is most efficient short of the sticks: 0.437 per throw on 47 attempts. It is Likely’s part of the field.
- New York’s defense does the opposite. It allows 0.061 EPA per dropback, almost a third of Washington’s rate. Daniels simulates to 219 passing yards and 1.25 touchdowns, and his 90th-percentile outcome (22.4) is lower than Nabers’. On a night when Washington’s top receiver is out for the season and the depth chart has just turned over, that makes Daniels a flex play, not a captain.
See the full showdown analysis. Captain board, every prop against our projection, the optimizer and exposure.
Captain and build
Nabers is the captain. Weighting each player’s ceiling over his projection, Daniels and Nabers come out level at the top (22.6 and 22.1). Daniels, though, is on more than half of rosters, and the simulation gives Nabers about ten more points of ceiling. Nabers is also the one most of the field will not have at captain. Both quarterbacks go in the flex, because in a game this close one of them throwing for 250 yards is the likeliest way the slate breaks open. Likely gets the Giants’ second pass-catcher slot ahead of Fields: he is the more efficient player in the area Washington concedes, and he is on 5% of rosters to Fields’ 62%.
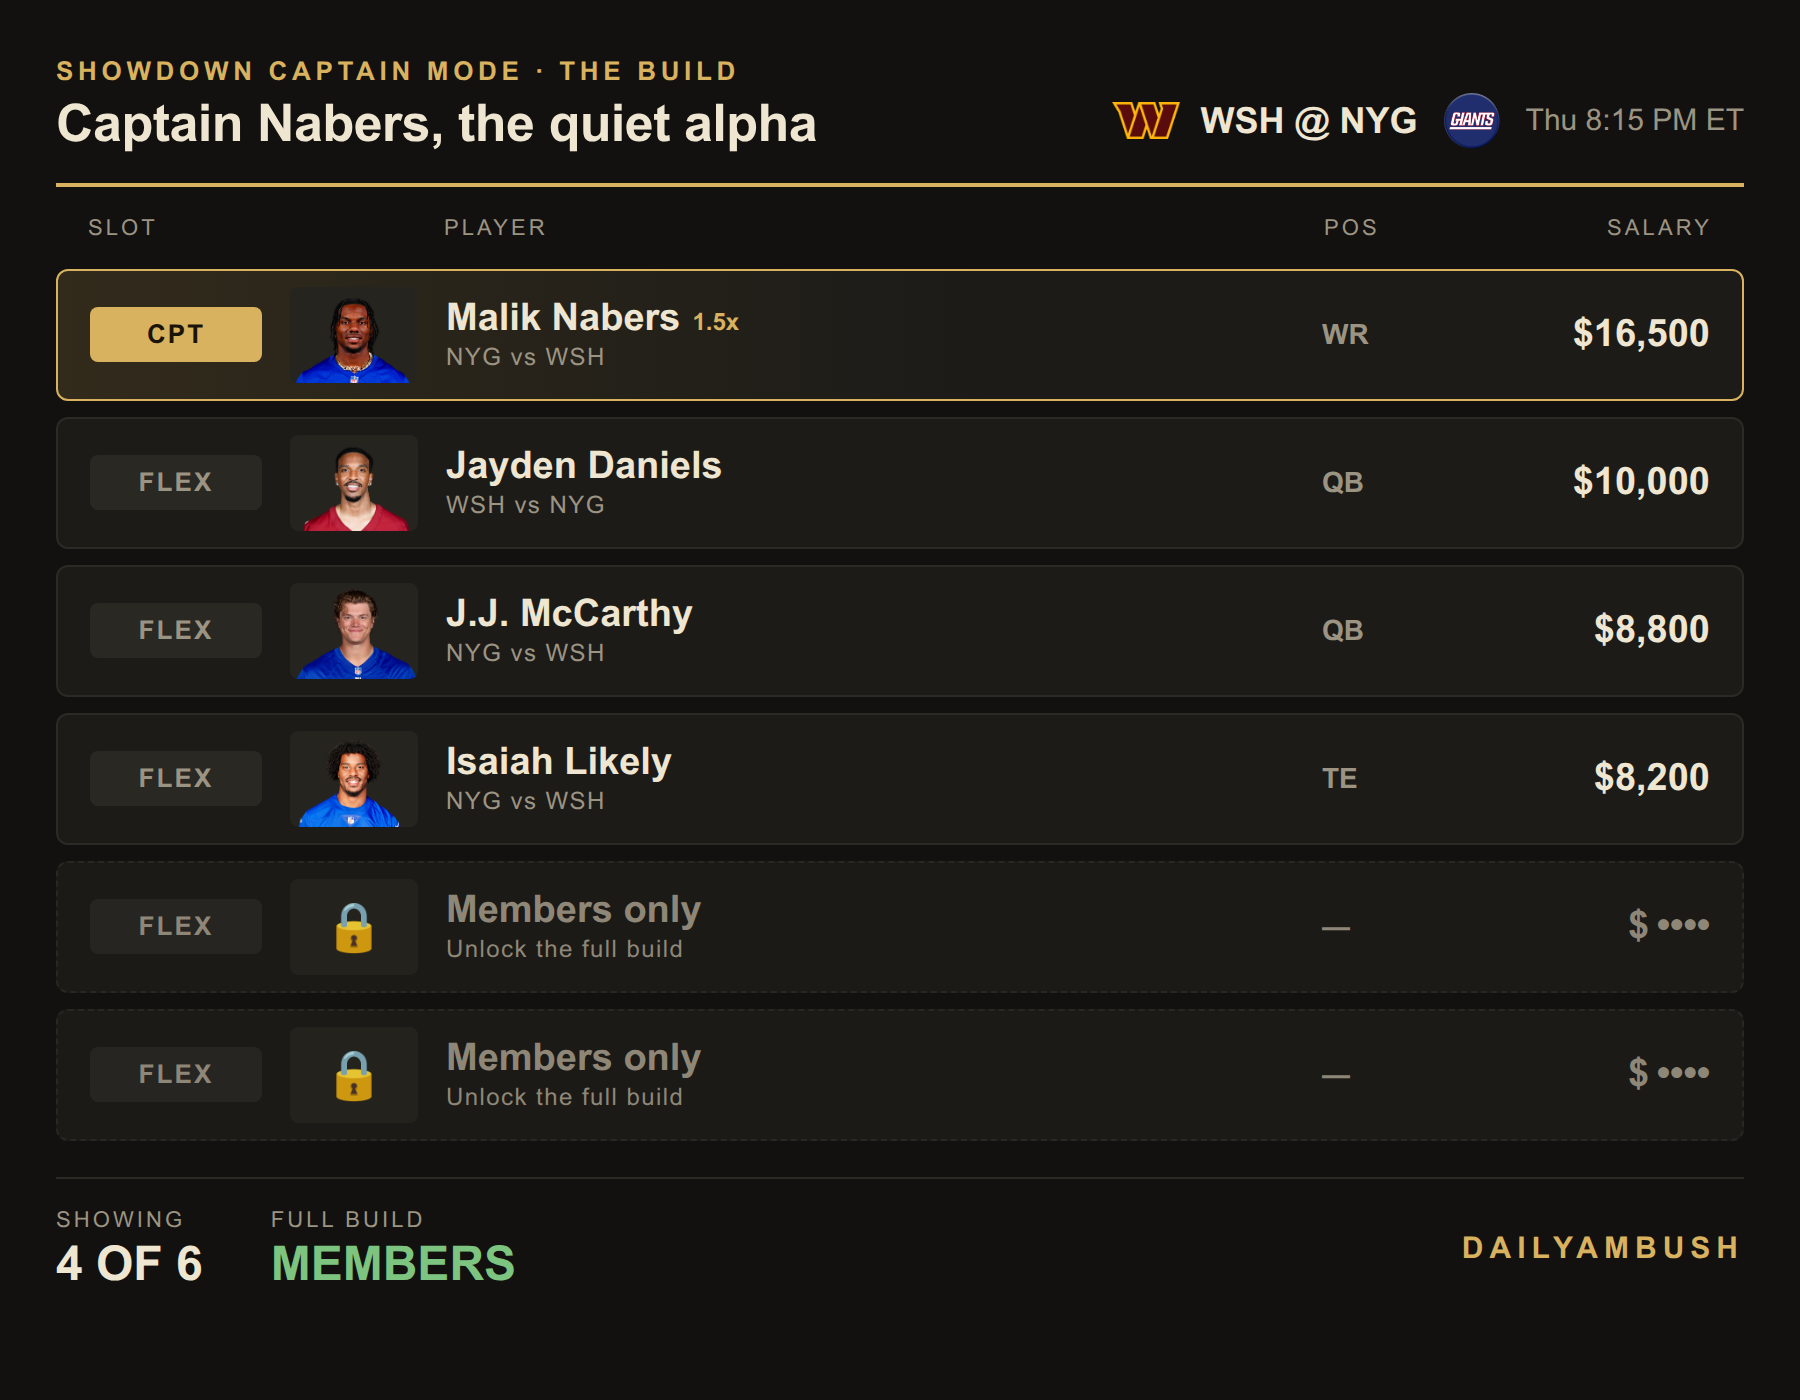
The last two spots are members-only. Get the full build, plus the Showdown Lab optimizer for your own.
The bets
- Stefon Diggs Under 4.5 receptions, -163 (DraftKings; -174 at FanDuel). The simulation has him at 3.3 catches on 5.5 targets, and our projection is 4.2. Either way, five catches is above his median. The Bureau’s number had this near 67%, and the break-even at -163 is 62%. It was -157 earlier in the week, so don’t chase it past -170.
- Malachi Fields Under 2.5 receptions, -157 (DraftKings; -165 at BetMGM). This is the bet that goes with the 62% ownership. The sim gives Fields 1.8 catches on 3.1 targets, and three catches means beating that by more than a full reception in a rain game that runs through Nabers and Likely.
No side, no total and no captain touchdown. The over is a coin flip in our simulation, and the market has already moved 5.5 points to reach that. Washington at +120 (DraftKings) wins 46.4% of our runs against a 45.5% break-even, which is too thin to bet. Nabers at +175 is the obvious captain touchdown, and our model supports only half of that price.
Method: model touchdown probability = 1 − e−λ, where λ is projected rushing plus receiving touchdowns. The simulation draws each team’s points around its Vegas implied total and builds everything inside the game (pace, pass rate, target and carry shares, catch rate) from our play-by-play. All numbers are from the DailyAmbush showdown ratings, projections, simulation and Bureau board as of Thursday morning. Lines move, so check your book before the 8:15 ET kickoff.