
Before Baker Mayfield dislocated his right thumb, this game opened at Dallas -3.5 with a total of 52.5. It is now Dallas -8.5 and 47.5: five points on the spread and five off the total, all of it on one hand. Jalon Daniels, an undrafted rookie, makes his second start on a short week and his first on the road. His first went 148 passing yards, one touchdown, two interceptions, three sacks and 55 yards on the ground. Tampa Bay is 0-4, but it lost those games by a combined 20 points and never by more than seven. Dallas is 2-2 and allows 28 points a game.
The market is right that the quarterback change matters. It gets carried away on the other half of the field. The Cowboys’ defense is allowing 0.572 EPA per dropback, and the four Dallas games have averaged 58.5 combined points. The lowest of them, 48, is still higher than tonight’s total. Tampa’s defense is the reverse. It shuts down the run (opponents lose 0.171 EPA per carry), and it plays tonight without Antoine Winfield Jr. and Benjamin Morrison in the secondary. Our 20,000-game simulation, which uses the market’s own team totals, lands on a coin flip for the spread (Dallas covers 49.5%) and for the total (49.6% Over). The DFS field has made up its mind anyway: Dak Prescott is on 62% of rosters and CeeDee Lamb is on 7.2%. Where we break from the field:
- CeeDee Lamb: the highest ceiling in the pool, against the weakest version of Tampa’s secondary, at a fraction of his quarterback’s ownership.
- Where Dallas scores: through the air. Javonte Williams runs into the one part of the Bucs that works.
- Tampa’s touchdowns: Bucky Irving and Cade Otton are the two prices our model supports, and both are starters.
Model vs. market: anytime touchdowns
We turned projected rushing and receiving touchdowns into the probability of scoring at least once and compared it with the best price at the six books we use. Our projections usually run lighter on touchdowns than the books, so the ratio is the column to read: the share of the market’s price that our model supports.
| Player | Best price | Market | Model | Ratio |
|---|---|---|---|---|
| Javonte WilliamsDAL · RB | -200 | 66.7% | 60.3% | 0.90 |
| CeeDee LambDAL · WR | -105 | 51.2% | 28.8% | 0.56 |
| Jake FergusonDAL · TE | +230 | 30.3% | 27.5% | 0.91 |
| Emeka EgbukaTB · WR | +310 | 24.4% | 16.1% | 0.66 |
| Bucky IrvingTB · RB | +180 | 35.7% | 39.1% | 1.09 |
| Cade OttonTB · TE | +550 | 15.4% | 18.0% | 1.17 |
The two Tampa players are the only starters on the board above 1.00. Irving has had 15 or more touches in every game this season, and our projection gives him 13 carries and 0.43 rushing touchdowns. The simulation is more generous still, at about 48%. He shares some of the goal-line work, which is why the book has him at +180 and not shorter. Otton plays nearly every snap and caught Daniels’ attention right away: six targets in the rookie’s first start, second on the team. Dallas gives up 0.853 EPA per throw to the short middle, its worst area on any real sample, and that’s where a tight end lives. Lamb’s 0.56 is the warning on the board. Even the simulation, which gives him 0.59 touchdowns, only gets him to about 45% against the 51.2% the price implies. His case is catches and yards, and on a showdown that’s enough.
Model vs. market: ownership
The field is building Dallas stacks without the receiver Dallas throws to. Prescott is at 62%, Lamb at 7.2% and George Pickens at 10.7%. Lamb has the highest ceiling of anyone in the pool (30.2), and his simulated 90th percentile is 33.0 on 10.5 targets. He leads the league in catches and receiving yards through four weeks, and his targets rose by 13 last week. Pickens’ 25.7 ceiling would be the story in most games. In this one he’s the second-best way to get the same exposure.
The ownership is going into salary relief instead. KaVontae Turpin ($1,200) and Emari Demercado ($400) are both projected at 62% for under three points apiece. Daniels is at 41%, which is fair for a quarterback who ran for 55 yards in his first start against a defense that leaks through the air. Williams at 20% is the one Dallas starter we’re lighter on than the field. Tampa’s run defense is the best unit on either side tonight, and his touchdown price already says what his projection says.
Our Board rates the Cowboys DST 78.5 as a captain at 5.4% owned. The whole case is the rookie quarterback, though: Dallas has four sacks and no interceptions in four games, and only 18 QB hits.
Team context worth carrying
- Tampa Bay: the Bucs’ target history belongs to Mayfield and doesn’t carry over to this game. In Daniels’ start, Chris Godwin got seven targets, Otton six, and Egbuka and Ted Hurst four each. Godwin’s snaps rose 27 points to 89%, and Egbuka’s targets fell by five. A rookie under pressure works short, and Dallas concedes short.
- Dallas: the Cowboys’ offense runs at 0.238 EPA per play with a 50.2% success rate, and Prescott’s best areas are downfield (0.919 EPA per throw deep right, 0.681 deep left). Tampa’s secondary was already allowing 0.145 EPA per dropback before it lost its two best defensive backs. The run defense is intact, the pass defense isn’t, and that decides where Dallas’ 28 implied points come from.
See the full showdown analysis. Captain board, every prop against our projection, the optimizer and exposure.
Captain and build
Lamb is the captain. On our ceiling-weighted ranking (65% ceiling, 35% projection), he and Prescott sit about a point apart at the top of the pool, and the field has picked Prescott eight and a half times as often. We play both. Prescott goes in the flex, where 253 simulated passing yards and 1.82 touchdowns work without our needing the same multiplier as everyone else. Daniels is the Tampa quarterback at $8,600. He projects for 17.5 points, and his legs give him a floor that his passing doesn’t. Otton is the fourth spot, for the reasons in the touchdown table: he’s a full-time tight end, Daniels looked for him early, and the short middle is where Dallas bleeds. The bet is that Dallas wins through the air and Tampa keeps the game close enough to keep throwing short.
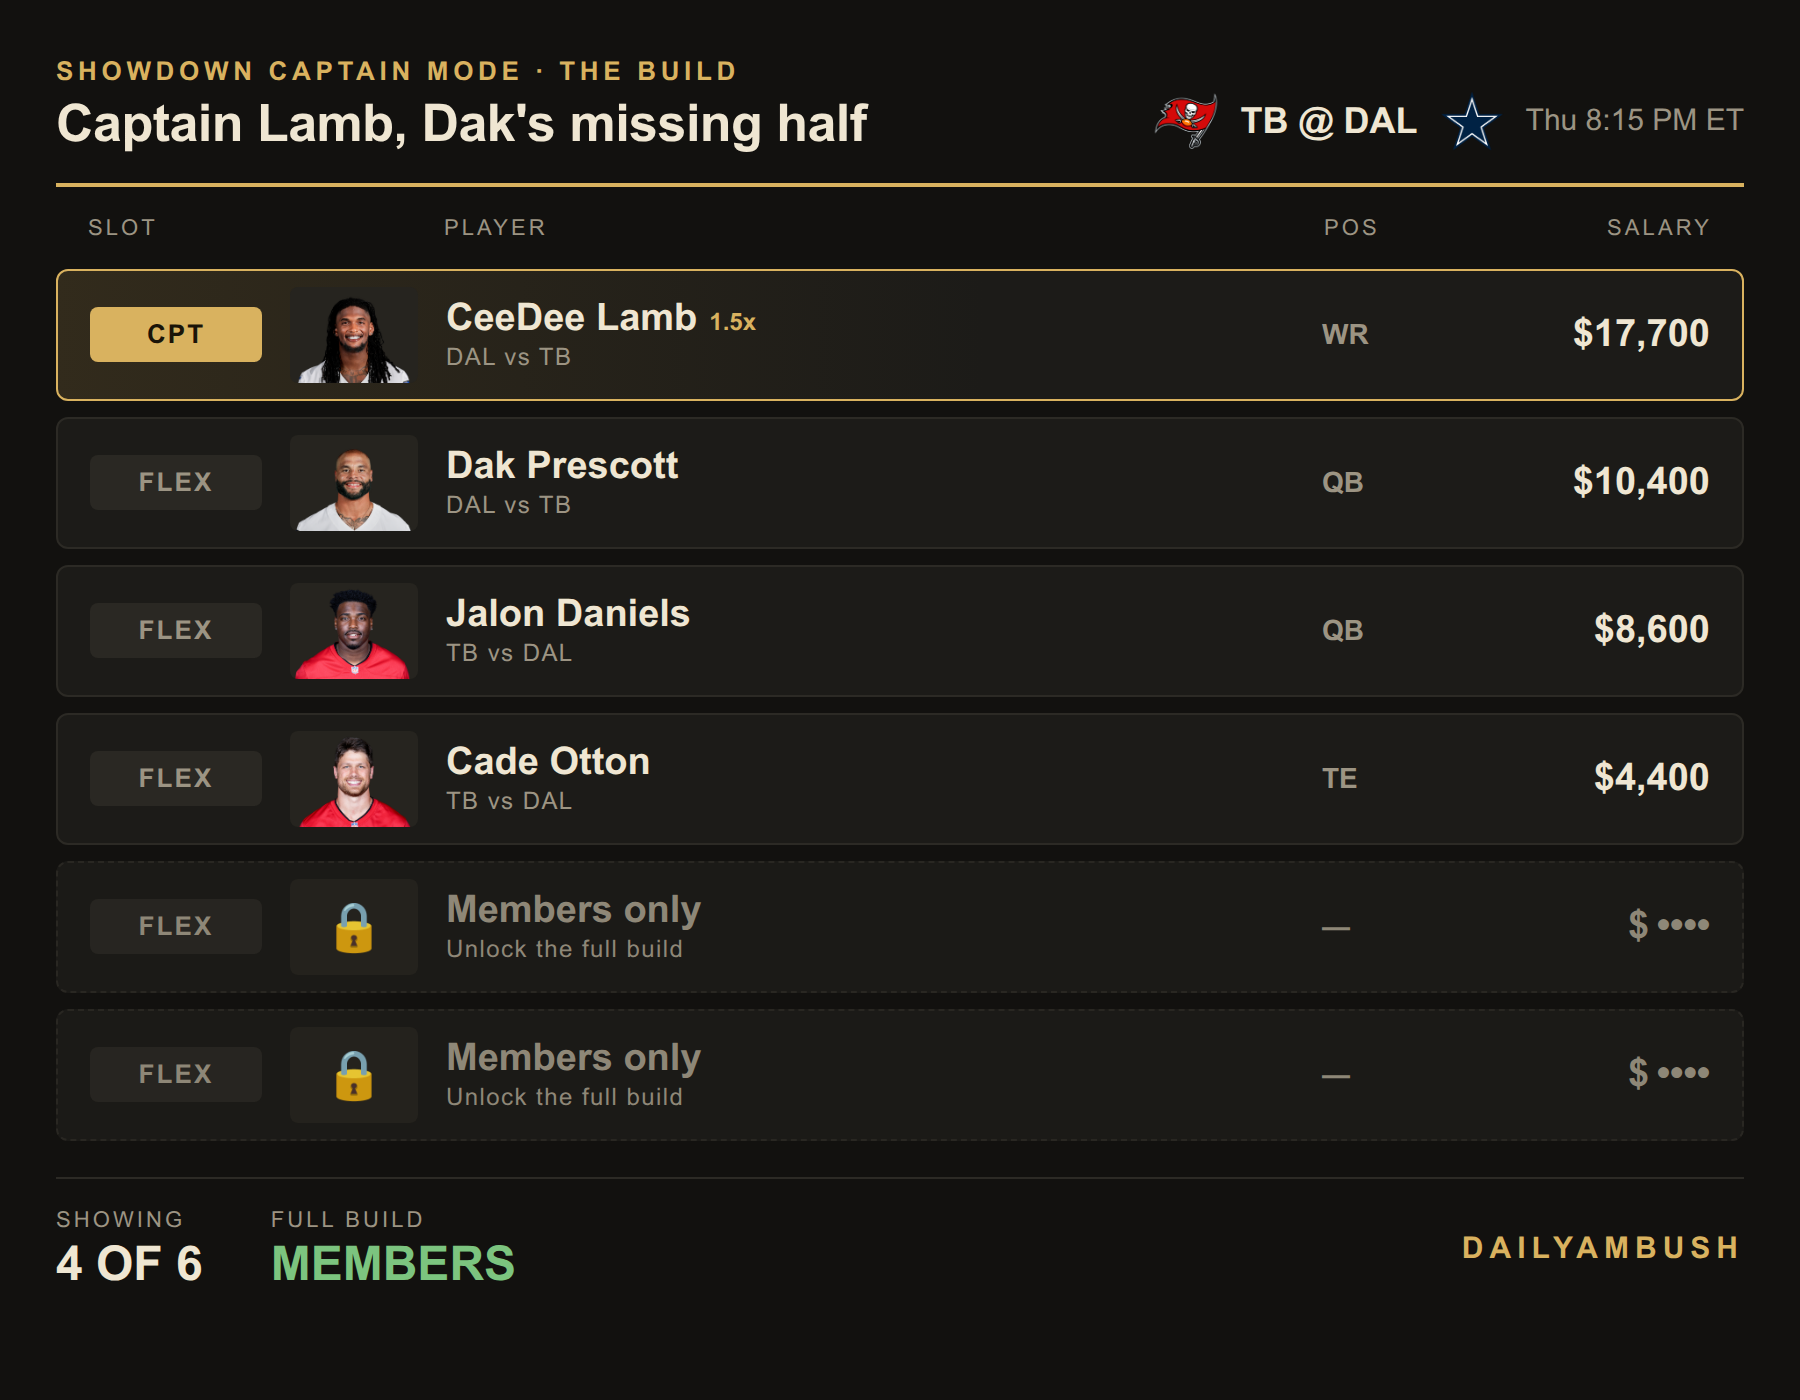
The last two spots are members-only. Get the full build, plus the Showdown Lab optimizer for your own.
The bets
- Bucky Irving anytime TD, +180 (FanDuel; +176 at Caesars, +175 at DraftKings and BetMGM). Our projection has him at 39.1% and the simulation near 48%, against the 35.7% the price implies. Our Bureau flagged it earlier in the week at +195. The price has come in, but it’s still a bet.
- Cade Otton anytime TD, +550 (DraftKings; +500 at FanDuel and Caesars). Our model has him at 18.0% against an implied 15.4%. He’s a full-time tight end facing the defense’s worst area, with a rookie quarterback who already threw to him six times. Keep it small.
There’s no captain touchdown this week. Lamb’s best price, -105 at BetMGM, implies 51.2%, and our model supports 28.8%. We’re also passing on the Bureau’s Otton Under 3.5 receptions (-125 at BetMGM): our projection has him at 3.6 catches and the simulation at 3.8, which is too close to the line to bet against him. The Bucs moneyline only shows value at a book outside our six. At +360 here it’s the market price. The spread and total both come out near 50% in the simulation, so there’s no bet on either.
Method: model touchdown probability = 1 − e−λ, where λ is projected rushing plus receiving touchdowns. Game simulation: 20,000 runs, team scoring drawn around the market’s implied totals, with everything inside from our play-by-play. Tampa’s receiving shares in the simulation lean on Mayfield’s history, so for Daniels and his targets we use our projections and his first start. All numbers are from the DailyAmbush showdown ratings, projections and Bureau board as of Thursday. Lines move, so check your book before the 8:15 ET kickoff.