
New Orleans has scored more points than Pittsburgh this season, 152 to 137, and it is a three-point underdog at its own home game, which is being played in Paris at 9:30 in the morning Eastern. The Saints get to pick the jerseys. That’s about where the home-field advantage ends. The spread makes sense once you turn to the other side of the ball: the Saints have allowed 178 points in six games, 45 of them to Atlanta, and their defense gives up 0.224 EPA per dropback, more than four times Pittsburgh’s 0.052. The money agrees. New Orleans opened +1.5 and is now +3, and the total has climbed from 41.5 to 43 or 43.5 at the US books.
The matchup isn’t as one-sided as the record. Pittsburgh’s defense has one area that breaks: deep right, where it allows 0.891 EPA per throw on 13 attempts. That happens to be New Orleans’ best area of the field, at 0.862 per throw on 15. On Tyler Shough’s own target history, his deep receiver is Chris Olave: 146 targets, a 13.2-yard average depth, 99-1,303-8. Olave’s snaps fell to 58% last week after an illness scare. He is off the injury report, and the field is pricing last week’s snap count anyway. He is on 10.3% of rosters.
That is the first of three places where we think the crowd has this wrong:
- Chris Olave: the highest simulated ceiling in the game (57.8 DK points), the matchup’s one open door, and 10% owned. He is our captain.
- New Orleans’ backfield: DFS has Alvin Kamara on 39% of rosters at $7,000, while the touchdown board has already handed his job to Kendre Miller. Both are a little wrong, in opposite directions.
- Shough’s yardage: his passing line has fallen from the 230s to 215.5 this week. We project 239 and the sim lands on 304.
Model vs. market: anytime touchdowns
We turned projected rushing and receiving touchdowns into a probability of scoring at least once and compared it with the best price at the six books. As usual our projections run below the market on touchdowns, so the ratio is the number to read: how much of the market’s price our model supports.
| Player | Best price | Market | Model | Ratio |
|---|---|---|---|---|
| Jaylen WarrenPIT · RB | -105 | 51.2% | 39.8% | 0.78 |
| Juwan JohnsonNO · TE | +310 | 24.4% | 19.8% | 0.81 |
| Chris OlaveNO · WR | +200 | 33.3% | 22.9% | 0.69 |
| Kendre MillerNO · RB | +185 | 35.1% | 20.9% | 0.60 |
| DK MetcalfPIT · WR | +180 | 35.7% | 18.9% | 0.53 |
| Alvin KamaraNO · RB | +400 | 20.0% | 37.5% | 1.88 |
The New Orleans backfield is where this table gets interesting. The books have Miller at +185 and Kamara at +400, so they have decided the job changed hands. Miller’s snaps rose 13 points to 44% last week and his carries by 10, so they have a point. Our projections still give Kamara 12 carries to Miller’s 6. Our simulation, which leans on recent usage, flips that to 7.5 for Miller and 5.4 for Kamara. Even there, Kamara scores in 27.4% of games against a 20.0% price, and Miller scores in 28.1% against 35.1%. Every number we have says the market overcorrected.
Warren is the other row worth a second look. At 0.78 our projections don’t support the price, but the simulation gives him 14.4 carries and 0.66 rushing touchdowns and has him scoring in 58% of games, above the 51% the books are asking. Metcalf at 0.53 is a yardage receiver: on Aaron Rodgers’ history, 100 targets have produced two touchdowns.
Model vs. market: ownership
Four players carry most of the field’s money: Shough at 62.0%, Bryce Lance at 54.3%, Kamara at 39.0% and Rodgers at 33.2%. Shough is earned. He has the highest simulated mean in the game (20.3) on a projected 36 attempts. Lance is not. He’s a $3,000 receiver on a lot of rosters, and on Shough’s history he has seven catches on 21 targets at −0.676 EPA per target, the worst number on either quarterback’s list. Kamara at 39% is being rostered as a workhorse. The sim gives him a 7.7-point mean, which is a part-time back’s number at a starter’s price.
The ceilings the field isn’t paying for all belong to starters. Olave (57.8 simulated ceiling) is at 10.3%, Warren (51.2) at 10.4% and Metcalf (47.1) at 9.2%. Devaughn Vele is the extreme case: a 51.5-point ceiling, second only to Olave’s, on 4.0% of rosters. He has four end-zone targets this season to Olave’s one, and his 7.0 simulated targets make him a real role, not a dart.
Team context worth carrying
- Pittsburgh: New Orleans’ worst area of the field is deep left, at 1.184 EPA per throw on 14 attempts. Pittsburgh has thrown there 15 times this season at −0.034. Rodgers gets his value on the short middle (0.552 on 41), and he’s down to two established wide receivers with Michael Pittman Jr., Roman Wilson and Ben Skowronek all out. Pittsburgh doesn’t use the open door on its side, which is why Warren, not the passing game, is where we expect its points.
- New Orleans: the Saints have lost their starting left tackle and left guard for the season, and they face a pass rush with 16 sacks and 35 quarterback hits in six games, T.J. Watt leading with 4.5. The sim sacks Shough 3.0 times, the most on the field. That’s the real risk to our Shough yardage bet, and it’s priced into the sim’s 304 already.
See the full showdown analysis. Captain board, every prop against our projection, the optimizer and exposure.
Captain and build
Olave is the captain. Ranked on ceiling first (0.65 ceiling plus 0.35 projection), the top three are Olave, Shough and Warren, within 1.2 points of each other. Olave is the one the field is avoiding. The sim gives him 9.9 targets, 99 yards and a 90th-percentile game of 30.6 points, and he gets the one area of the field where Pittsburgh’s defense breaks. Shough goes in the flex, where his 62% ownership only counts once and his passing volume pays off the captain. Warren has Pittsburgh’s highest simulated ceiling (51.2) and is on only 10% of rosters. Juwan Johnson is the fourth spot: he is second on Shough’s history with 92 targets (71-822-5, 0.394 EPA per target), and the sim gives him 5.5 targets.
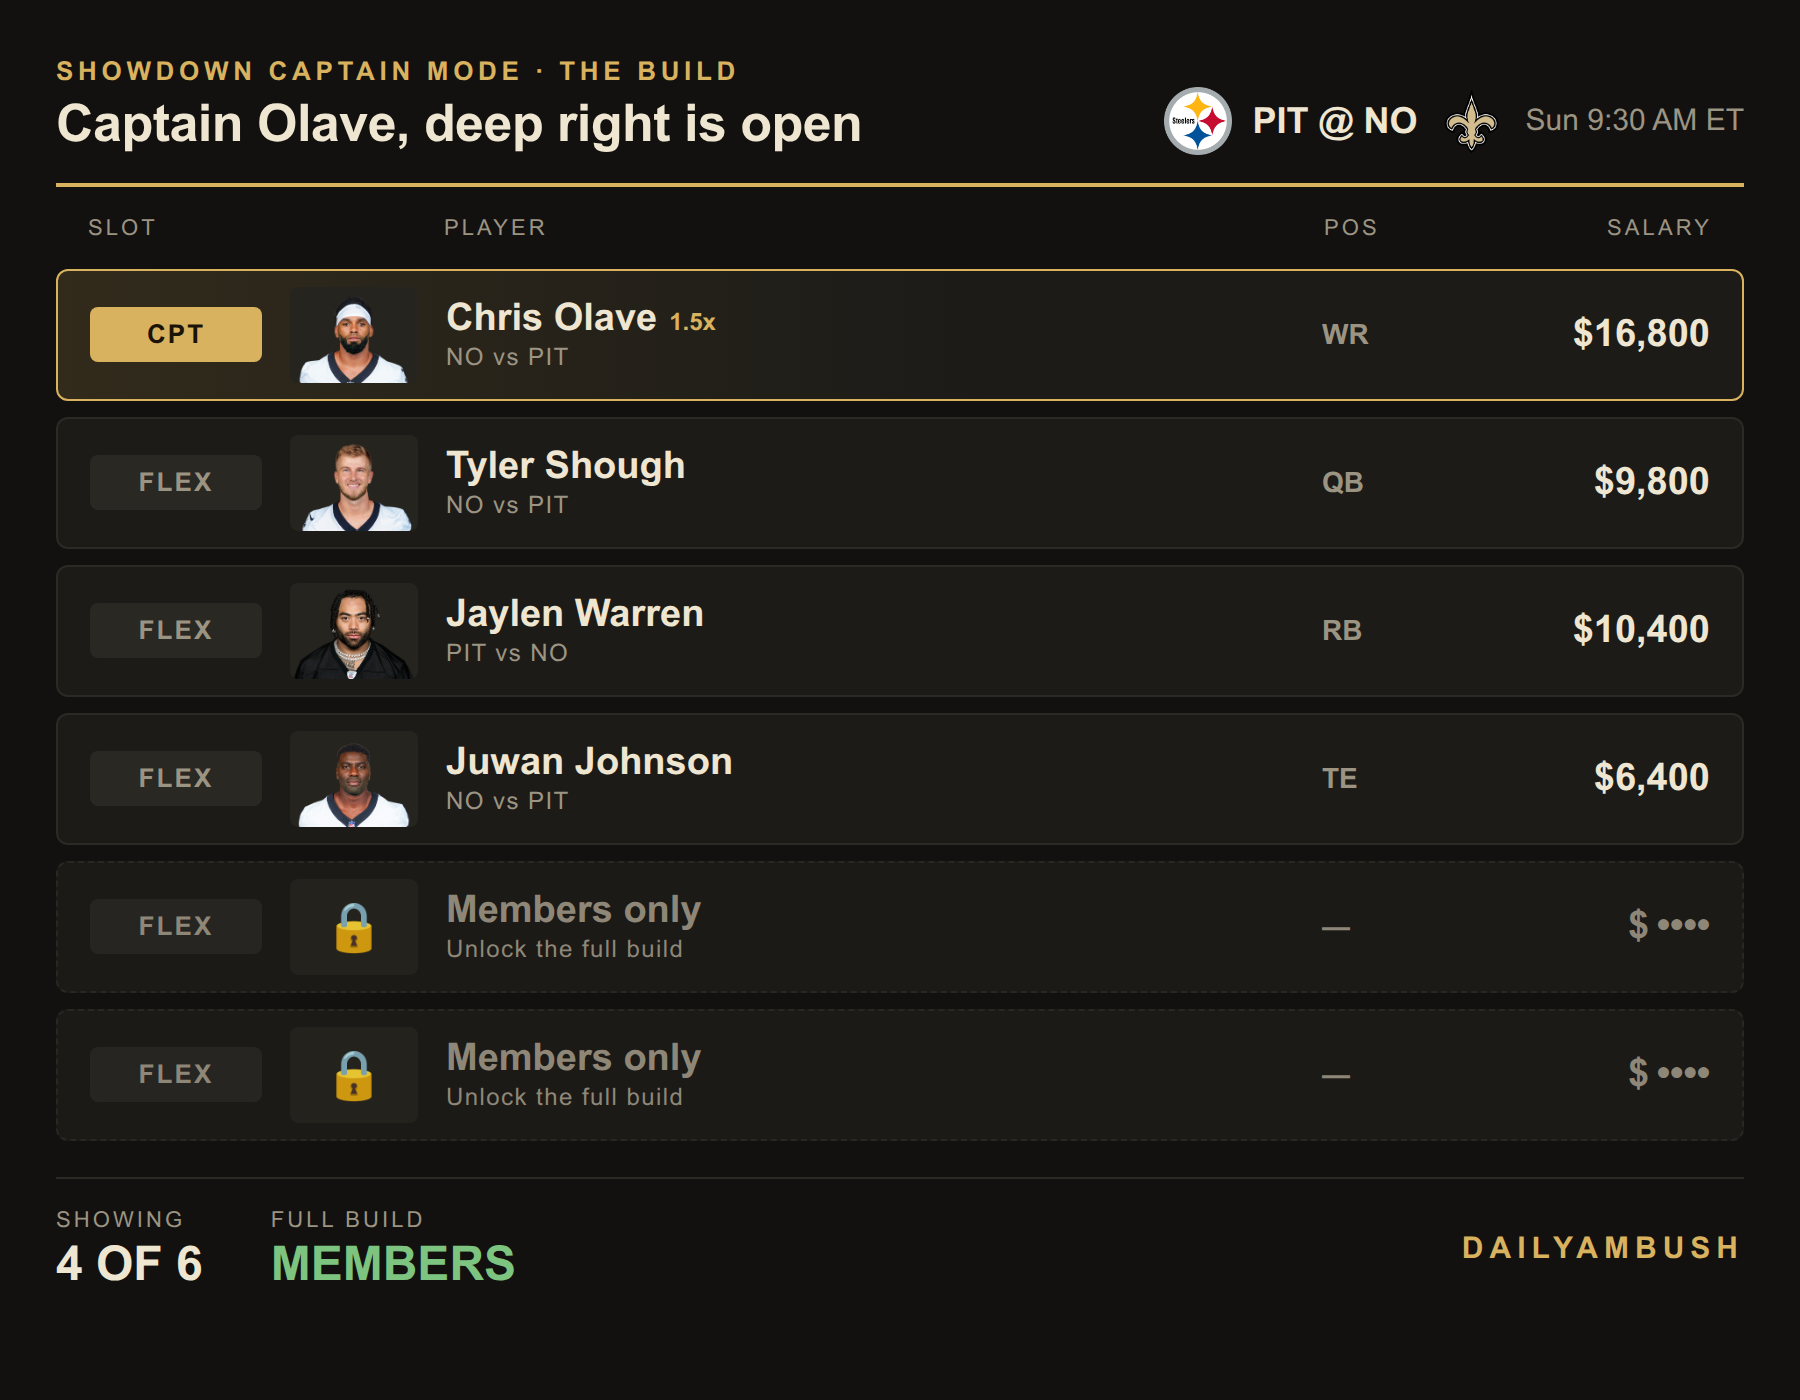
The last two spots are members-only. Get the full build, plus the Showdown Lab optimizer for your own.
The bets
- Tyler Shough Over 215.5 passing yards, -113 (DraftKings; 221.5 at FanDuel and BetMGM). The line has dropped about 16 yards this week. Our projection (239) and the sim (304 on 36 attempts) both clear it, the sim by a long way. New Orleans throws on a league-fast pace and is the team expected to trail. The sacks are the risk; the number is low enough to absorb them.
- Alvin Kamara anytime TD, +400 (DraftKings; +360 at FanDuel, Fanatics and BetMGM). Our projections have him at 37.5%, the sim at 27.4%, and the price implies 20.0%. The books have moved the goal-line work to Miller faster than any of our usage numbers have. Keep it small. This is a bet on a role the market thinks is gone.
- Pat Freiermuth Under 3.5 receptions, -160 (DraftKings). Darnell Washington’s snaps rose 8 points to 71% last week and his targets by 3; Freiermuth’s targets fell by 4. We project 2.1 catches and the sim 2.7 on 4.3 targets. The price needs 61.5% and both of our numbers are comfortably above it.
No captain touchdown: Olave’s best price is +200, and our model supports 0.69 of it. No total and no spread either. The sim lands the over 49.9% of the time. Pittsburgh covers -3 in 53.3%, which beats the 51.5% break-even at FanDuel’s -106 by less than we’re willing to bet on a key number.
Method: model touchdown probability = 1 − e−λ, where λ is projected rushing plus receiving touchdowns. All numbers are from the DailyAmbush showdown ratings, projections, 20,000-run game simulation and Bureau board as of Sunday morning. Lines move, so check your book before the 9:30 ET kickoff.