
Buffalo and Minnesota are both 6-1, and they got there playing different sports. The Bills’ seven games have averaged 59.1 combined points. They have given up 30 or more four times and won all four. The Vikings’ games have averaged 33.3, nobody has scored more than 22 on them, and one of their wins was 9-3 over Chicago, which counts as a football score only in the technical sense. That 9-3 game was also the last time Carson Wentz started, and with Kyler Murray hurt he starts again tonight.
The betting market has read that as a points problem, not a who-wins problem. The total opened at 48.5 and is 44 now. The spread barely moved: Minnesota went from +3.5 to +3. Our simulation keeps the market’s team totals (Bills 23.2, Vikings 20.2), but what happens inside those totals is ours. It finds a game Buffalo wins on the ground: 27.3 Bills rushes to 20.9 passes, and Josh Allen at only 161 passing yards. Ownership hasn’t caught up with that, and it hasn’t caught up with what changed in Minnesota’s backfield either:
- Minnesota’s backfield: the field splits Aaron Jones Sr. and Jordan Mason almost evenly. Our simulation doesn’t. Jones played 40% of snaps last week and Mason 28%, and the sim gives Jones 13.3 carries to Mason’s 4.6.
- Tai Felton: on 62% of rosters at a near-minimum salary after playing 7% of the snaps in his last game.
- Justin Jefferson’s yardage: 77.5 at the books, 49 in our sim on 24 Minnesota passes. He belongs in builds, just not as the captain.
Model vs. market: anytime touchdowns
We converted projected rushing and receiving touchdowns into a probability of scoring at least once, then compared it with the best price at the six books. The ratio shows how much of the market’s price our model supports.
| Player | Best price | Market | Model | Ratio |
|---|---|---|---|---|
| James Cook IIIBUF · RB | -105 | 51.2% | 53.7% | 1.05 |
| Josh AllenBUF · QB | -115 | 53.5% | 20.1% | 0.38 |
| Justin JeffersonMIN · WR | +165 | 37.7% | 25.9% | 0.69 |
| T.J. HockensonMIN · TE | +250 | 28.6% | 19.7% | 0.69 |
| Jordan MasonMIN · RB | +220 | 31.3% | 30.2% | 0.96 |
| Aaron Jones Sr.MIN · RB | +290 | 25.6% | 30.0% | 1.17 |
Every touchdown price our model fully supports belongs to a running back, which is what you’d expect in a game simulated at 51 rushes. Cook is the only favorite on the board the model backs. Jones at +290 is the widest gap, and that’s on our projections, which split Minnesota’s carries almost evenly (10 for Mason, 9 for Jones). The simulation goes further and puts Jones at 0.66 expected touchdowns. Mason is fairly priced, and that’s all he is.
Allen at 0.38 is the number that will annoy people. The market prices him like a goal-line back. We have him for 6 rushes and 0.23 rushing touchdowns, which is plenty for a quarterback and nowhere near a coin flip. Jefferson and Hockenson both sit at 0.69: the books are pricing Minnesota’s passing game the way it looked with Murray throwing.
Model vs. market: ownership
Buffalo’s two runners of the ball are the chalk: Cook 55.0% and Allen 47.7%. That’s earned. They are first and second in our sim means (16.7 for Allen, 15.1 for Cook), and no other Bills skill player tops 7.4. Projected ownership doesn’t see the Minnesota backfield the way we do. Jones (22.2%, $7,000) and Mason (20.1%, $6,400) are owned like a timeshare. In 20,000 sims Jones averages 13.0 DK points with a 44.3 ceiling. Mason averages 3.4 with a ceiling of 21.5, and his carries fell by seven from one week to the next.
The biggest mispricing in the pool is Felton. He’s priced near the minimum and on 62% of rosters, and his role went from 66% of snaps to 7% in his last game. Our sim gives him 1.5 targets and a 2.6-point mean. A salary that low isn’t value if the player isn’t on the field. Wentz at 25.3% and $9,000 is fair: a 14.2-point projection and a 21.8 ceiling, against Allen’s 19.4 and 28.1 for $2,400 more.
Minnesota’s DST ($3,600, 12.1%) is the one spot where a contrarian build makes sense. The Vikings have 25 sacks and 63 quarterback hits, and the sim has Allen taking 2.1 sacks to Minnesota’s 1.4. That build needs Buffalo to stall, and ours doesn’t expect it to.
Team context worth carrying
- Buffalo: 0.259 EPA per play and a 52.0% success rate, against a Minnesota defense allowing -0.041 per play and -0.081 per run. Cook is running into the best unit on the field. The sim gives him 17.5 carries anyway, because Buffalo doesn’t need to throw to win this script.
- Minnesota: Buffalo’s pass defense allows 0.275 EPA per dropback, worst on throws deep left (0.679) and deep right (0.642). The Vikings have attempted 20 deep-left passes. Wentz gets about 24 throws to find out whether he can still hit them.
See the full showdown analysis. Captain board, every prop against our projection, the optimizer and exposure.
Captain and build
Cook is the captain. Allen and Jefferson rate a little higher on our Board’s ceiling blend, but in the 20,000 sims Cook has the top ceiling in the game (44.4) and a 90th percentile of 23.4, level with Allen’s 23.5. His touchdown is also the only favorite’s price our model backs. Allen goes in the flex, where his rushing still scores without carrying a captain multiplier he only fills in the game’s best outcomes. Jefferson is the Minnesota piece: his 43.1 sim ceiling is the best on that side, even with the yardage we doubt. Jones follows from the backfield read above.
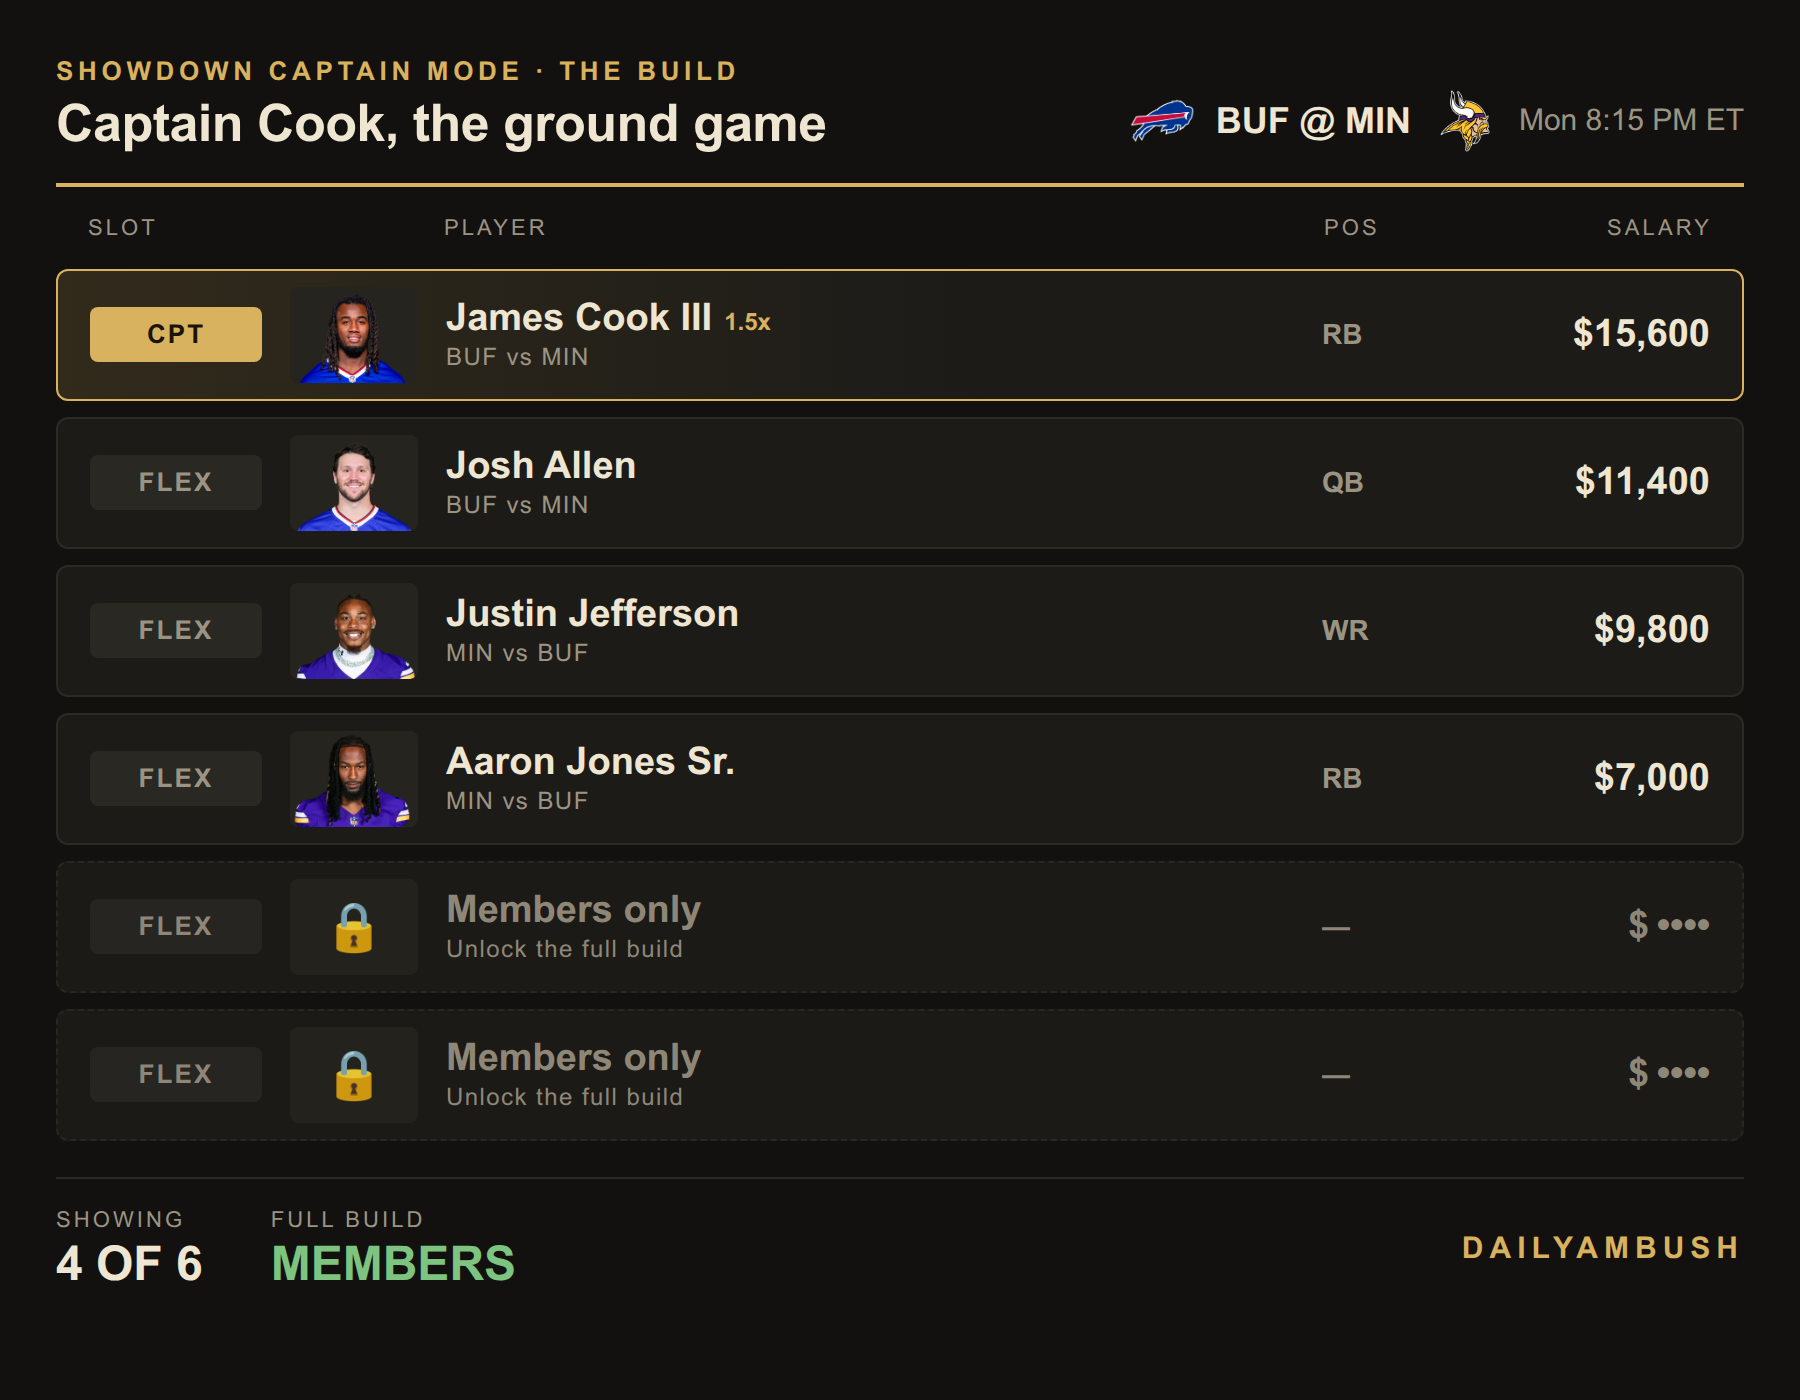
The last two spots are members-only. Get the full build, plus the Showdown Lab optimizer for your own.
The bets
- James Cook III anytime TD, -105 (DraftKings, FanDuel). The captain’s touchdown, at a price our model beats: 53.7% against 51.2%. In a game simulated at 27 Buffalo rushes, he is the most likely scorer on the field.
- Aaron Jones Sr. anytime TD, +290 (DraftKings, FanDuel). The widest gap on the board: 30.0% on our projections against a 25.6% price, and higher still in the sim. He led Minnesota’s backfield in snaps last week. If you’d rather bet the role than the touchdown, his rushing Over 31.5 is -113 at FanDuel, and the sim has him at 59 yards.
- Carson Wentz Under 209.5 passing yards, -111 (DraftKings; -113 FanDuel). Our projection is 168, and the simulation’s Minnesota passing line is 191. Both are well below 209.5. The market moved the total 4.5 points on his start but left his yardage priced like a normal week.
No total and no side. The under money has already taken the total from 48.5 to 44, and at 43.5 our sim actually leans Over (52.6%), which isn’t enough to beat -115. On the spread, the sim has Minnesota covering +3 46.6% of the time, which isn’t enough to back either side.
Method: model touchdown probability = 1 − e−λ, where λ is projected rushing plus receiving touchdowns (Jefferson’s from our 20,000-run game simulation). All numbers are from the DailyAmbush showdown ratings, projections, simulation and Bureau board as of Monday. Lines move, so check your book before the 8:15 ET kickoff.