
Tampa Bay ran the ball 45 and 52 times in its last two games and won them 43-13 and 16-0. Baker Mayfield has thrown 14 passes since coming back from the thumb he dislocated in Week 3, which makes the Buccaneers’ recent offense less a passing game than a clock-management seminar. Chicago, meanwhile, won 34-17 in Seattle on Monday night, added Jeffery Simmons to the defensive line, and watched the spread grow from Bears -3.5 at the open to -6 on a short week, with the total sliding from 49.5 to 47.5.
The run-heavy plan is pointed at the wrong half of this defense. Chicago allows -0.051 EPA per run and 0.168 per dropback, and the deep middle, deep left and deep right have each given up more than half a point per attempt. Tampa can grind the clock against the Bears’ strength, but the first deficit pushes Mayfield toward their weakness. Our 20,000-run simulation keeps the market’s 20.8 and 26.8 team totals and puts the shape on top. It has Chicago winning 63.6% of the time, not the roughly 70% the moneyline implies, and covering -6 in only 47.6%. That’s where the crowd is pricing last week’s box scores:
- Tampa Bay’s backfield: Kenny Gainwell is projected for 62% ownership off one big week. Bucky Irving is at 12.1%, and the simulation has him scoring almost twice as many points.
- Emeka Egbuka: Mayfield’s top target, the simulation’s highest ceiling in the game, and 3.0% owned.
- The price on Chicago: the move to -6 reflects one Monday night, not this matchup.
Model vs. market: anytime touchdowns
We turned projected rushing and receiving touchdowns into a probability of scoring at least once and compared it with the best price at the six books. Our touchdown rates run below the books’ prices almost everywhere, so the ratio is the number to watch: the share of the market’s price our model supports.
| Player | Best price | Market | Model | Ratio |
|---|---|---|---|---|
| D’Andre SwiftCHI · RB | -185 | 64.9% | 55.2% | 0.85 |
| Bucky IrvingTB · RB | +115 | 46.5% | 40.1% | 0.86 |
| Colston LovelandCHI · TE | +165 | 37.7% | 26.0% | 0.69 |
| Luther Burden IIICHI · WR | +165 | 37.7% | 22.1% | 0.59 |
| Emeka EgbukaTB · WR | +235 | 29.9% | 14.6% | 0.49 |
| Kenny GainwellTB · RB | +390 | 20.4% | 23.9% | 1.17 |
The two lead backs land at 0.85 and 0.86. That’s a solid read on both, but at -185 and +115 it isn’t a bet. Gainwell is the only price on the board our model beats, and it isn’t the angle: he is the No. 2 back behind Irving, and he is already the most popular cheap player on the slate. Egbuka’s 0.49 is a warning, not a fade. His case is targets and air yards, not end-zone work.
Model vs. market: ownership
The field is paying for the Tampa Bay that showed up last week. Gainwell had 25 carries against Atlanta, but he didn’t touch the ball until Irving already had eight. His projected 62% ownership at $4,800 is level with both starting quarterbacks. The simulation gives Irving 17 carries and a 14.7-point mean (22.8 at the 90th percentile), and Gainwell 6.7 carries and an 8.0 mean. Irving costs $9,800 and is 12.1% owned. The salary gap is real, but the ownership gap is far bigger.
Egbuka is the bigger mispricing. Across the 16 Mayfield starts we have logged, he has 117 targets, 29 more than anyone else, at a 12.3-yard average depth. That’s the kind of throw Chicago’s secondary has struggled to stop. The simulation gives him 6.0 targets, an 11.9-point mean, a 21.1-point 90th percentile and a 53.4-point ceiling, the highest of anyone in the game. He’s 3.0% owned at $8,400. Our Board projection is lower (8.4), because it leans on the run-heavy last two weeks. The simulation weights who Mayfield actually throws to.
On Chicago’s side, the field likes Rome Odunze (39.2%) over Burden (8.1%). The simulation has Burden slightly ahead on mean (11.7 to 10.0) with a 48.6-point ceiling, at less than a quarter of the ownership. Cade Otton at 50.9% is the opposite case: a 6.3-point simulated mean on 3.8 targets, and he’s one of our bets to stay quiet. On defense, the Bears DST is 4.7% owned and the Buccaneers 12%. Tampa’s defense has 12 interceptions, and the simulation has Caleb Williams throwing 0.62 a game, which makes the cheaper unit the better dart.
Team context worth carrying
- Chicago: the Bears’ most productive area is the short middle, at 0.401 EPA per attempt on 65 throws. It’s also Tampa Bay’s best area on defense: -0.147 on 43. Expect Loveland’s routes to be contested, and expect more of Chicago’s gains to come on the ground and on the edges.
- Tampa Bay: the Buccaneers’ defense allows -0.072 EPA per play, against Chicago’s +0.079, and it has 12 interceptions to Chicago’s 5. If the Bears are going to cover six, they’ll need to do it without giving the ball away.
See the full showdown analysis. Captain board, every prop against our projection, the optimizer and exposure.
Captain and build
Swift is the captain because the data says he’s the most likely winner, not because he’s contrarian. He has 51 touches to Roschon Johnson’s eight over the last two weeks, and the simulation gives him 18.2 carries, the top 90th percentile in the game (25.4) and a 45.8-point ceiling. His 41.5% ownership is a flex number; he’ll be well under that at captain, where most of the field will put Williams. Williams goes in the flex. Irving and Egbuka carry the Tampa Bay side: the back the field is skipping, and the receiver who gets the ball when the Buccaneers have to throw.
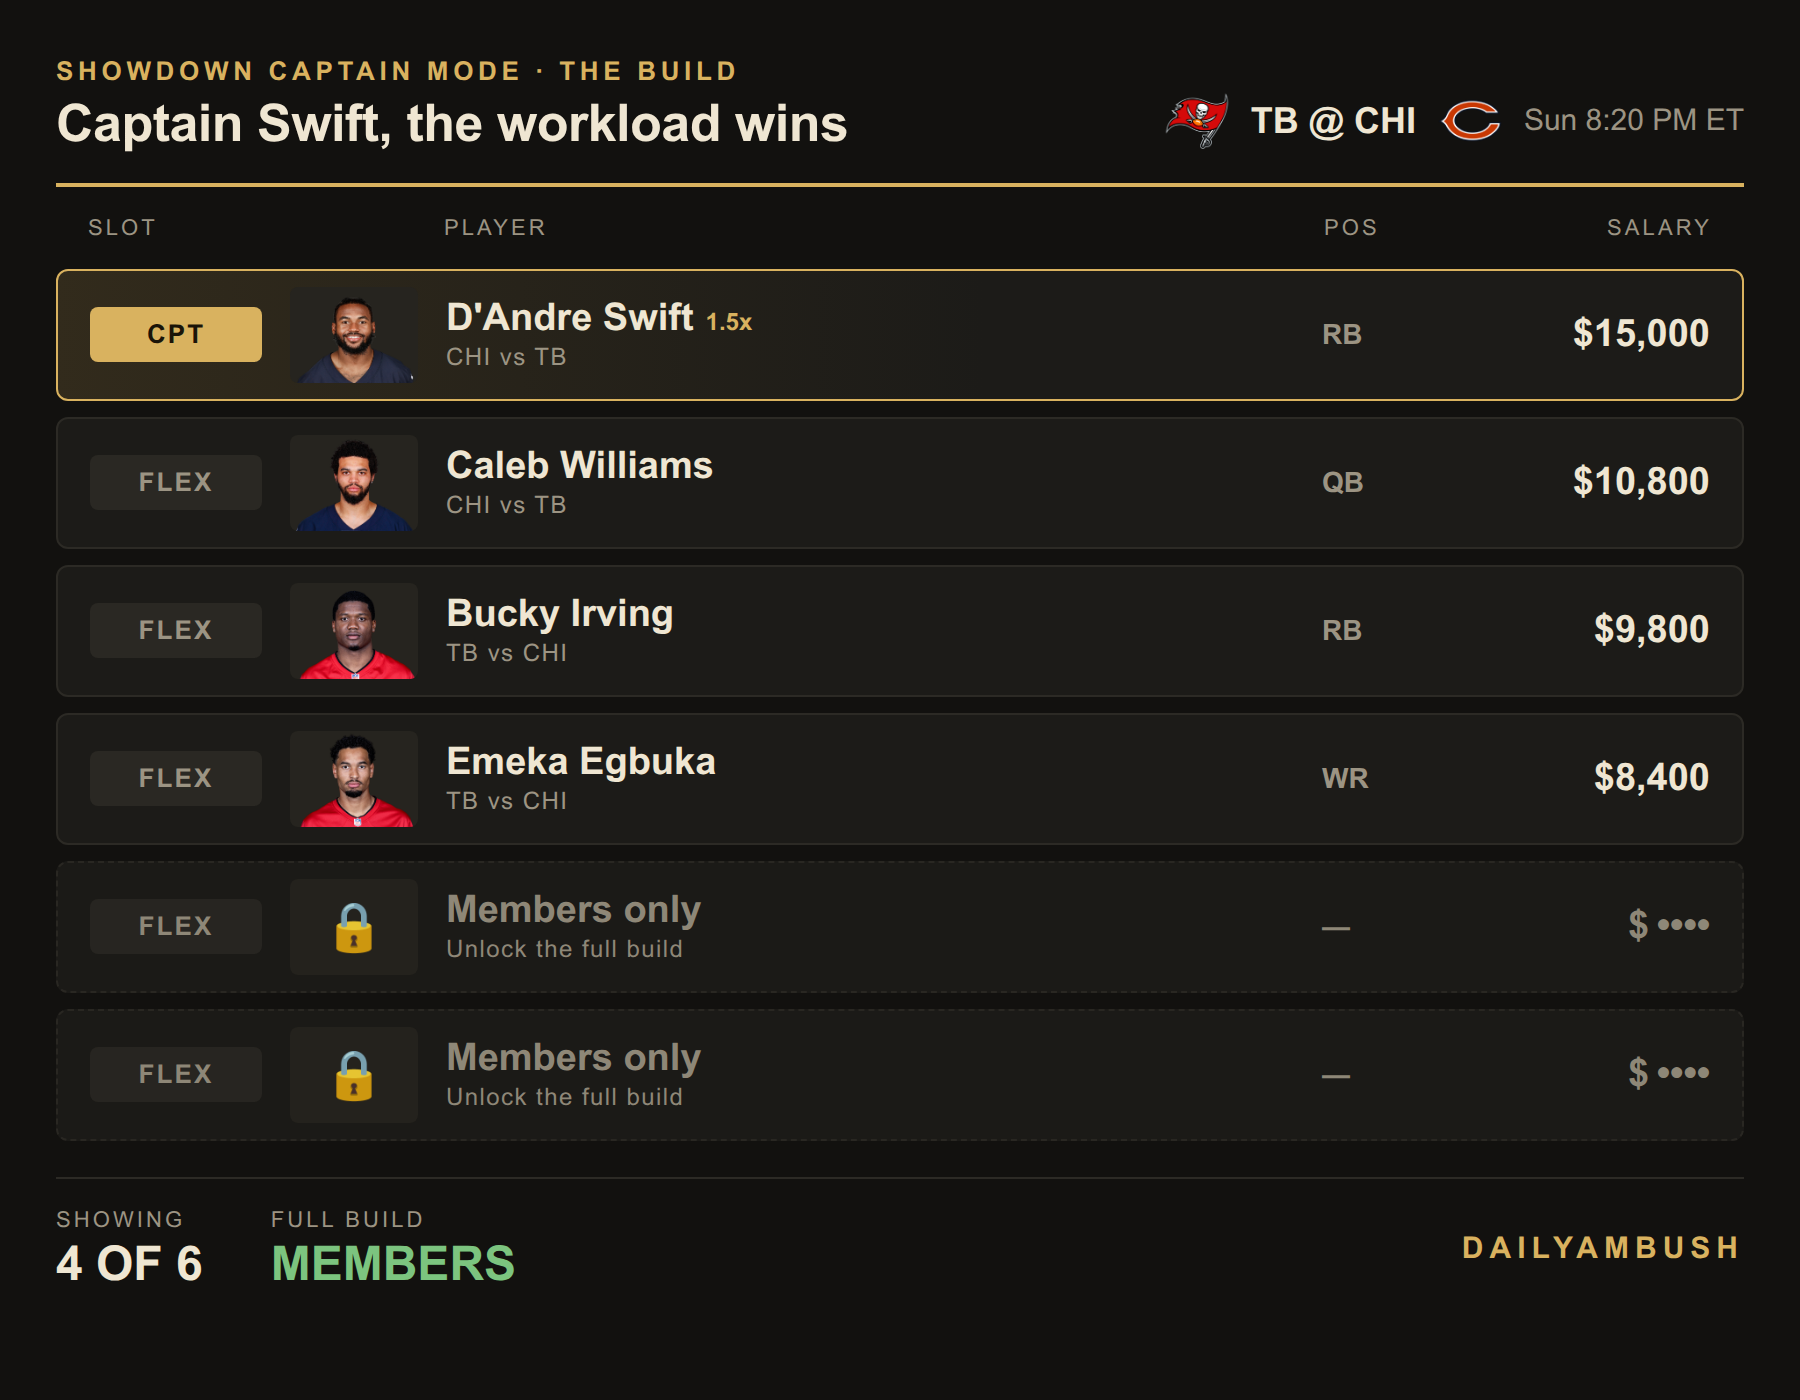
The last two spots are members-only. Get the full build, plus the Showdown Lab optimizer for your own.
The bets
- Cade Otton Under 3.5 receptions, -160 (FanDuel; -163 at DraftKings). Our model has the Under at 68%, the price implies 61.5%. He’s gone under this number in six of his last ten games, and the simulation has 2.5 catches on 3.8 targets for a tight end the field is rostering at better than 50%.
- Buccaneers moneyline, +225 (BetMGM; +220 at DraftKings, FanDuel and Hard Rock). The simulation has Tampa Bay winning 36.4% of the time and the price implies 30.8%. The line has moved 2.5 points on one Monday night. Keep it small; that’s still an underdog winning about once in three.
No captain touchdown bet this week. Swift’s -185 asks for 64.9% and our model gets him to 55.2%, so the price doesn’t work even though the role does. No total either: the simulation goes over 47.5 in 50.7% of runs, which is a coin flip at -110.
Method: model touchdown probability = 1 − e−λ, where λ is projected rushing plus receiving touchdowns. Simulated numbers come from 20,000 runs of this game built on our play-by-play, anchored to the market’s team totals. All numbers are from the DailyAmbush showdown ratings, projections, simulation and Bureau board as of Sunday afternoon. Lines move, so check your book before the 8:20 ET kickoff.